Pizza Hut 2010 Annual Report Download - page 56
Download and view the complete annual report
Please find page 56 of the 2010 Pizza Hut annual report below. You can navigate through the pages in the report by either clicking on the pages listed below, or by using the keyword search tool below to find specific information within the annual report.-
 1
1 -
2
-
3
-
4
-
5
-
6
-
7
-
8
-
9
-
10
-
11
-
12
-
13
-
14
-
15
-
16
-
17
-
18
-
19
-
20
-
21
-
22
-
23
-
24
-
25
-
26
-
27
-
28
-
29
-
30
-
31
-
32
-
33
-
34
-
35
-
36
-
37
-
38
-
39
-
40
-
41
-
42
-
43
-
44
-
45
-
 46
46 -
 47
47 -
 48
48 -
 49
49 -
 50
50 -
 51
51 -
 52
52 -
 53
53 -
 54
54 -
 55
55 -
 56
56 -
 57
57 -
 58
58 -
 59
59 -
 60
60 -
 61
61 -
 62
62 -
 63
63 -
 64
64 -
 65
65 -
 66
66 -
67
-
68
-
69
-
70
-
71
-
72
-
73
-
74
-
75
-
76
-
77
-
78
-
79
-
80
-
81
-
82
-
83
-
84
-
85
-
86
-
87
-
88
-
89
-
90
-
91
-
92
-
93
-
94
-
95
-
96
-
97
-
98
-
99
-
100
-
101
-
102
-
103
-
104
-
105
-
106
-
107
-
108
-
109
-
110
-
111
-
112
-
113
-
114
-
115
-
116
-
117
-
118
-
119
-
120
-
121
-
122
-
123
-
124
-
125
-
126
-
127
-
128
-
129
-
130
-
131
-
132
-
133
-
134
-
135
-
136
-
137
-
138
-
139
-
140
-
141
-
142
-
143
-
144
-
145
-
146
-
147
-
148
-
149
-
150
-
151
-
152
-
153
-
154
-
155
-
156
-
157
-
158
-
159
-
160
-
161
-
162
-
163
-
164
-
165
-
166
-
167
-
168
-
169
-
170
-
171
-
172
-
173
-
174
-
175
-
176
-
177
-
178
-
179
-
180
-
181
-
182
-
183
-
184
-
185
-
186
-
187
-
188
-
189
-
190
-
191
-
192
-
193
-
194
-
195
-
196
-
197
-
198
-
199
-
200
-
201
-
202
-
203
-
204
-
205
-
206
-
207
-
208
-
209
-
210
-
211
-
212
-
213
-
214
-
215
-
216
-
217
-
218
-
219
-
220
-
221
-
222
-
223
-
224
-
225
-
226
-
227
-
228
-
229
-
230
-
231
-
232
-
233
-
234
-
235
-
236
 |
 |

9MAR201101381779
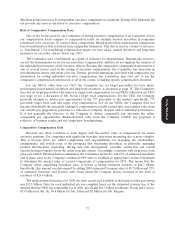
Meridian going forward as its independent executive compensation consultant. During 2010, Meridian did
not provide any services unrelated to executive compensation.
Role of Comparative Compensation Data
One of the factors used by our Committee in setting executive compensation is an evaluation of how
our compensation levels compare to compensation levels for similarly situated executives at companies
considered to be our peers. To conduct these comparisons, Meridian provided compensation comparisons
based on information that is derived from comparable businesses. This data is used as a frame of reference
(a ‘‘benchmark’’) for establishing compensation targets for base salary, annual incentives and long-term
incentives for executive officers below our CEO.
The Committee uses a benchmark as a point of reference for measurement. Benchmarks, however,
are not the determinative factor for our executives’ compensation, and they do not supplant the analyses of
the individual performance of the executive officers. Because the comparative compensation information is
one of several factors used in the setting of executive compensation, the Committee has discretion in
determining the nature and extent of its use. Further, given the limitations associated with comparative pay
information for setting individual executive compensation, the Committee may elect not to use the
comparative compensation information at all in the course of making specific compensation decisions.
For our NEOs, other than our CEO, the Committee has set target percentiles for base salary,
performance-based annual incentives and long-term incentives as discussed at page 38. The Committee
does not set target percentiles with respect to target total compensation for our NEOs other than our CEO
(see page 44 for a discussion of Mr. Novak’s target total compensation). For the CEO, the Company
generally attempts to deliver pay opportunities at the 75th percentile of the market—specifically, 75th
percentile target total cash and target total compensation. For all our NEOs, the Company does not
measure/benchmark the percentile ranking of compensation actually earned since any realized value from
our variable pay programs in particular is a function of company, division, and/or individual performance.
It is not generally the objective of the Company to deliver comparable pay outcomes but rather
comparable pay opportunities. Realized/earned value from the Company variable pay programs is
reflective of business results and not competitive benchmarking.
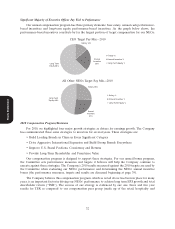
Proxy Statement
Comparative Compensation Data
Revenue size often correlates to some degree with the market value of compensation for senior
executive positions. For companies with significant franchise operations measuring size is more complex.
This is because there are added complexities and responsibilities for managing the relationships,
arrangements, and overall scope of the enterprise that franchising introduces, in particular, managing
product introductions, marketing, driving new unit development, customer satisfaction and overall
operations improvements across the entire franchise system. Accordingly, consistent with its practice from
prior years which Meridian had recommended, the Committee decided to add 25% of estimated franchisee
and licensee sales to the Company’s estimated 2009 sales to establish an appropriate revenue benchmark
to determine the market value of various components of compensation for 2010. This means that the
Company, when considering franchisee sales, is viewed as having estimated revenues of $16.3 billion.
Specifically, this amount was determined by adding 2009 estimated Company sales of $9.7 billion and 25%
of estimated franchisee and licensee sales (from which the Company derives revenues in the form of
royalties) of $26.4 billion.
The median annual revenues (for 2008, the most recent year available at that time) for this peer group
was $15.3 billion. Data for each individual job was compiled based on the estimated revenue size of the
division that the NEO was responsible for in 2009, specifically $16.3 billion for Messrs. Novak and Carucci,
$3.9 billion for Mr. Su, $4.8 billion for Mr. Allan and $2 billion for Mr. Bergren.
37