Pizza Hut 2010 Annual Report Download - page 60
Download and view the complete annual report
Please find page 60 of the 2010 Pizza Hut annual report below. You can navigate through the pages in the report by either clicking on the pages listed below, or by using the keyword search tool below to find specific information within the annual report.-
 1
1 -
2
-
3
-
4
-
5
-
6
-
7
-
8
-
9
-
10
-
11
-
12
-
13
-
14
-
15
-
16
-
17
-
18
-
19
-
20
-
21
-
22
-
23
-
24
-
25
-
26
-
27
-
28
-
29
-
30
-
31
-
32
-
33
-
34
-
35
-
36
-
37
-
38
-
39
-
40
-
41
-
42
-
43
-
44
-
45
-
46
-
47
-
48
-
49
-
 50
50 -
 51
51 -
 52
52 -
 53
53 -
 54
54 -
 55
55 -
 56
56 -
 57
57 -
 58
58 -
 59
59 -
 60
60 -
 61
61 -
 62
62 -
 63
63 -
 64
64 -
 65
65 -
 66
66 -
 67
67 -
 68
68 -
 69
69 -
 70
70 -
71
-
72
-
73
-
74
-
75
-
76
-
77
-
78
-
79
-
80
-
81
-
82
-
83
-
84
-
85
-
86
-
87
-
88
-
89
-
90
-
91
-
92
-
93
-
94
-
95
-
96
-
97
-
98
-
99
-
100
-
101
-
102
-
103
-
104
-
105
-
106
-
107
-
108
-
109
-
110
-
111
-
112
-
113
-
114
-
115
-
116
-
117
-
118
-
119
-
120
-
121
-
122
-
123
-
124
-
125
-
126
-
127
-
128
-
129
-
130
-
131
-
132
-
133
-
134
-
135
-
136
-
137
-
138
-
139
-
140
-
141
-
142
-
143
-
144
-
145
-
146
-
147
-
148
-
149
-
150
-
151
-
152
-
153
-
154
-
155
-
156
-
157
-
158
-
159
-
160
-
161
-
162
-
163
-
164
-
165
-
166
-
167
-
168
-
169
-
170
-
171
-
172
-
173
-
174
-
175
-
176
-
177
-
178
-
179
-
180
-
181
-
182
-
183
-
184
-
185
-
186
-
187
-
188
-
189
-
190
-
191
-
192
-
193
-
194
-
195
-
196
-
197
-
198
-
199
-
200
-
201
-
202
-
203
-
204
-
205
-
206
-
207
-
208
-
209
-
210
-
211
-
212
-
213
-
214
-
215
-
216
-
217
-
218
-
219
-
220
-
221
-
222
-
223
-
224
-
225
-
226
-
227
-
228
-
229
-
230
-
231
-
232
-
233
-
234
-
235
-
236
 |
 |

9MAR201101381779
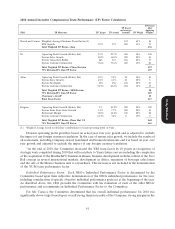
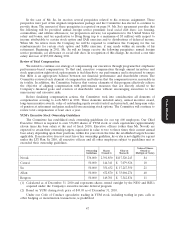
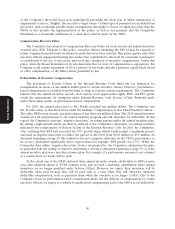
2010 Annual Incentive Compensation Team Performance (TP) Factor Calculation
TP Factor
TP based After
on leverage Applying
NEO TP Measures TP Target TP Actual formula TP Weight Weights\
Novak and Carucci Weighted Average Divisions’ Team Factors(1) 132 65% 86
EPS Growth 10% 17% 200 35% 70
Total Weighted TP Factor—Yum 156
Su Operating Profit Growth (Before Tax) 15% 25.7% 200 50% 100
System Sales Growth 10.0% 16.8% 200 20% 40
System Gross New Builds 465 521 186 20% 37
System Customer Satisfaction 73.6% 77.6% 200 10% 20
Total Weighted TP Factor—China Division 197
75% Division/25% Yum TP Factor 187
Allan Operating Profit Growth (Before Tax) 10% 9.5% 90 50% 45
System Sales Growth 6.0% 4.1% 23 20% 5
System Net Builds 450 456 106 20% 21
System Customer Satisfaction 54.9% 60.2% 188 10% 19
Total Weighted TP Factor—YRI Division 90
75% Division/25% Yum TP Factor 107
Chairman’s Award* 10
Final Team Factor 117
Bergren Operating Profit Growth (Before Tax) 5% 10.2% 200 50% 100
System Same Store Sales Growth 3.5% 7.7% 200 20% 40
Restaurant Margin 12.0% 12.4% 140 20% 28
System Customer Satisfaction 61.5% 56% 0 10% 0
Total Weighted TP Factor—Pizza Hut U.S. 168
Proxy Statement
75% Division/25% Yum TP Factor 165
(1) Weighted average based on divisions’ contribution to overall operating profit of Yum
Division operating profit growth is based on actual year over year growth and is adjusted to exclude
the impact of any foreign currency translation. In the case of system sales growth, we include the results of
all restaurants, including Company-owned, franchised and licensed restaurants and it is based on year over
year growth and adjusted to exclude the impact of any foreign currency translation.
*At the end of 2010, the Committee increased the YRI team factor by 10 points in recognition of
strategic work completed during 2010 that will contribute to Yum’s future success including the completion
of the acquisition of the Rostiks/KFC business in Russia, business development in India, rollout of the Taco
Bell concept in several international markets, development in Africa, expansion of beverage sales layers
and the sale of the Mexico business unit to a franchisee. This increase is not included in the determination
of the YUM team performance factor.
Individual Performance Factor. Each NEO’s Individual Performance Factor is determined by the
Committee based upon their subjective determination of the NEOs individual performance for the year,
including consideration of specific objective individual performance goals set at the beginning of the year.
As described above, the CEO provides the Committee with his evaluation of each of the other NEOs’
performance and recommends an Individual Performance Factor to the Committee.
For Mr. Carucci, the Committee determined that his overall individual performance for 2010 was
significantly above target based upon overall strong financial results of the Company, strong margins in the
41