Pizza Hut 2010 Annual Report Download - page 191
Download and view the complete annual report
Please find page 191 of the 2010 Pizza Hut annual report below. You can navigate through the pages in the report by either clicking on the pages listed below, or by using the keyword search tool below to find specific information within the annual report.-
 1
1 -
2
-
3
-
4
-
5
-
6
-
7
-
8
-
9
-
10
-
11
-
12
-
13
-
14
-
15
-
16
-
17
-
18
-
19
-
20
-
21
-
22
-
23
-
24
-
25
-
26
-
27
-
28
-
29
-
30
-
31
-
32
-
33
-
34
-
35
-
36
-
37
-
38
-
39
-
40
-
41
-
42
-
43
-
44
-
45
-
46
-
47
-
48
-
49
-
50
-
51
-
52
-
53
-
54
-
55
-
56
-
57
-
58
-
59
-
60
-
61
-
62
-
63
-
64
-
65
-
66
-
67
-
68
-
69
-
70
-
71
-
72
-
73
-
74
-
75
-
76
-
77
-
78
-
79
-
80
-
81
-
82
-
83
-
84
-
85
-
86
-
87
-
88
-
89
-
90
-
91
-
92
-
93
-
94
-
95
-
96
-
97
-
98
-
99
-
100
-
101
-
102
-
103
-
104
-
105
-
106
-
107
-
108
-
109
-
110
-
111
-
112
-
113
-
114
-
115
-
116
-
117
-
118
-
119
-
120
-
121
-
122
-
123
-
124
-
125
-
126
-
127
-
128
-
129
-
130
-
131
-
132
-
133
-
134
-
135
-
136
-
137
-
138
-
139
-
140
-
141
-
142
-
143
-
144
-
145
-
146
-
147
-
148
-
149
-
150
-
151
-
152
-
153
-
154
-
155
-
156
-
157
-
158
-
159
-
160
-
161
-
162
-
163
-
164
-
165
-
166
-
167
-
168
-
169
-
170
-
171
-
172
-
173
-
174
-
175
-
176
-
177
-
178
-
179
-
180
-
 181
181 -
 182
182 -
 183
183 -
 184
184 -
 185
185 -
 186
186 -
 187
187 -
 188
188 -
 189
189 -
 190
190 -
 191
191 -
 192
192 -
 193
193 -
 194
194 -
 195
195 -
 196
196 -
 197
197 -
 198
198 -
 199
199 -
 200
200 -
 201
201 -
202
-
203
-
204
-
205
-
206
-
207
-
208
-
209
-
210
-
211
-
212
-
213
-
214
-
215
-
216
-
217
-
218
-
219
-
220
-
221
-
222
-
223
-
224
-
225
-
226
-
227
-
228
-
229
-
230
-
231
-
232
-
233
-
234
-
235
-
236
 |
 |

94
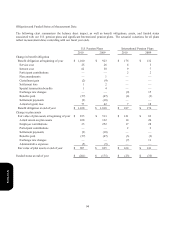
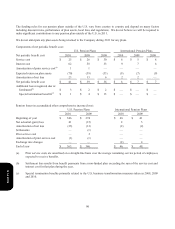
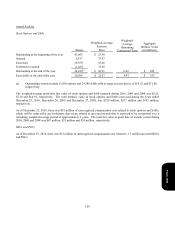
Obligation and Funded Status at Measurement Date:
The following chart summarizes the balance sheet impact, as well as benefit obligations, assets, and funded status
associated with our U.S. pension plans and significant International pension plans. The actuarial valuations for all plans
reflect measurement dates coinciding with our fiscal year ends.
U.S. Pension Plans International Pension Plans
2010 2009 2010 2009
Change in benefit obligation
Benefit obligation at beginning of year $ 1,010 $ 923 $ 176 $ 132
Service cost 25 26 6 5
Interest cost 62 58 9 7
Participant contributions
—
—
22
Plan amendments
—
1
—
—
Curtailment gain (2
)
(9)
—
—
Settlement loss 1 2
—
—
Special termination benefits 1 4
—
—
Exchange rate changes
—
—
(9
)
15
Benefits paid (57
)
(47) (4
)
(3)
Settlement payments (9
)
(10
)
—
—
Actuarial (gain) loss 77 62 7 18
Benefit obligation at end of year $ 1,108 $ 1,010 $ 187 $ 176
Change in plan assets
Fair value of plan assets at beginning of year $ 835 $ 513 $ 141 $ 83
Actual return on plan assets 108 132 14 20
Employer contributions 35 252 17 28
Participant contributions
—
—
2 2
Settlement payments (9
)
(10)
—
—
Benefits paid (57
)
(47) (3
)
(3
)
Exchange rate changes
—
—
(7
)
11
Administrative expenses (5
)
(5)
—
—
Fair value of plan assets at end of yea
r
$ 907 $ 835 $ 164 $ 141
Funded status at end of year $ (201
)
$ (175) $ (23
)
$ (35
)
Form 10-K