Pizza Hut 2010 Annual Report Download - page 180
Download and view the complete annual report
Please find page 180 of the 2010 Pizza Hut annual report below. You can navigate through the pages in the report by either clicking on the pages listed below, or by using the keyword search tool below to find specific information within the annual report.-
 1
1 -
2
-
3
-
4
-
5
-
6
-
7
-
8
-
9
-
10
-
11
-
12
-
13
-
14
-
15
-
16
-
17
-
18
-
19
-
20
-
21
-
22
-
23
-
24
-
25
-
26
-
27
-
28
-
29
-
30
-
31
-
32
-
33
-
34
-
35
-
36
-
37
-
38
-
39
-
40
-
41
-
42
-
43
-
44
-
45
-
46
-
47
-
48
-
49
-
50
-
51
-
52
-
53
-
54
-
55
-
56
-
57
-
58
-
59
-
60
-
61
-
62
-
63
-
64
-
65
-
66
-
67
-
68
-
69
-
70
-
71
-
72
-
73
-
74
-
75
-
76
-
77
-
78
-
79
-
80
-
81
-
82
-
83
-
84
-
85
-
86
-
87
-
88
-
89
-
90
-
91
-
92
-
93
-
94
-
95
-
96
-
97
-
98
-
99
-
100
-
101
-
102
-
103
-
104
-
105
-
106
-
107
-
108
-
109
-
110
-
111
-
112
-
113
-
114
-
115
-
116
-
117
-
118
-
119
-
120
-
121
-
122
-
123
-
124
-
125
-
126
-
127
-
128
-
129
-
130
-
131
-
132
-
133
-
134
-
135
-
136
-
137
-
138
-
139
-
140
-
141
-
142
-
143
-
144
-
145
-
146
-
147
-
148
-
149
-
150
-
151
-
152
-
153
-
154
-
155
-
156
-
157
-
158
-
159
-
160
-
161
-
162
-
163
-
164
-
165
-
166
-
167
-
168
-
169
-
 170
170 -
 171
171 -
 172
172 -
 173
173 -
 174
174 -
 175
175 -
 176
176 -
 177
177 -
 178
178 -
 179
179 -
 180
180 -
 181
181 -
 182
182 -
 183
183 -
 184
184 -
 185
185 -
 186
186 -
 187
187 -
 188
188 -
 189
189 -
 190
190 -
191
-
192
-
193
-
194
-
195
-
196
-
197
-
198
-
199
-
200
-
201
-
202
-
203
-
204
-
205
-
206
-
207
-
208
-
209
-
210
-
211
-
212
-
213
-
214
-
215
-
216
-
217
-
218
-
219
-
220
-
221
-
222
-
223
-
224
-
225
-
226
-
227
-
228
-
229
-
230
-
231
-
232
-
233
-
234
-
235
-
236
 |
 |

83
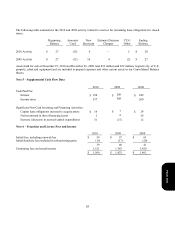
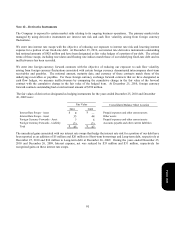
The following table summarizes the 2010 and 2009 activity related to reserves for remaining lease obligations for closed
stores.
Beginning
Balance
Amounts
Used
New
Decisions
E
stimate/Decision
Changes
CTA/
Other
Ending
Balance
2010 Activity $ 27 (12
)
8
—
5$ 28
2009 Activity $ 27 (12) 10 4 (2
)
$27
Assets held for sale at December 25, 2010 and December 26, 2009 total $23 million and $32 million, respectively, of U.S.
property, plant and equipment and are included in prepaid expenses and other current assets in our Consolidated Balance
Sheets.
Note 5 – Supplemental Cash Flow Data
2010 2009 2008
Cash Paid For:
Interest
$190
$
20
9
$248
Income taxes 357 308 260
Significant Non-Cash Investing and Financing Activities:
Capital lease obligations incurred to acquire assets $16
$
7
$ 24
Net investment in direct financing leases 2 8
26
Increase (decrease) in accrued capital expenditures 51 (1
7
) 12
Note 6 – Franchise and License Fees and Income
2010 2009 2008
Initial fees, including renewal fees $ 5
4
$ 5
7
$ 61
Initial franchise fees included in refranchising gains (15) (1
7
) (2
0
)
3
9
4
0
41
Continuing fees and rental income 1,521 1,383 1,42
0
$ 1,56
0
$ 1,423 $ 1,461
Form 10-K