Pizza Hut 2010 Annual Report Download - page 127
Download and view the complete annual report
Please find page 127 of the 2010 Pizza Hut annual report below. You can navigate through the pages in the report by either clicking on the pages listed below, or by using the keyword search tool below to find specific information within the annual report.-
 1
1 -
2
-
3
-
4
-
5
-
6
-
7
-
8
-
9
-
10
-
11
-
12
-
13
-
14
-
15
-
16
-
17
-
18
-
19
-
20
-
21
-
22
-
23
-
24
-
25
-
26
-
27
-
28
-
29
-
30
-
31
-
32
-
33
-
34
-
35
-
36
-
37
-
38
-
39
-
40
-
41
-
42
-
43
-
44
-
45
-
46
-
47
-
48
-
49
-
50
-
51
-
52
-
53
-
54
-
55
-
56
-
57
-
58
-
59
-
60
-
61
-
62
-
63
-
64
-
65
-
66
-
67
-
68
-
69
-
70
-
71
-
72
-
73
-
74
-
75
-
76
-
77
-
78
-
79
-
80
-
81
-
82
-
83
-
84
-
85
-
86
-
87
-
88
-
89
-
90
-
91
-
92
-
93
-
94
-
95
-
96
-
97
-
98
-
99
-
100
-
101
-
102
-
103
-
104
-
105
-
106
-
107
-
108
-
109
-
110
-
111
-
112
-
113
-
114
-
115
-
116
-
 117
117 -
 118
118 -
 119
119 -
 120
120 -
 121
121 -
 122
122 -
 123
123 -
 124
124 -
 125
125 -
 126
126 -
 127
127 -
 128
128 -
 129
129 -
 130
130 -
 131
131 -
 132
132 -
 133
133 -
 134
134 -
 135
135 -
 136
136 -
 137
137 -
138
-
139
-
140
-
141
-
142
-
143
-
144
-
145
-
146
-
147
-
148
-
149
-
150
-
151
-
152
-
153
-
154
-
155
-
156
-
157
-
158
-
159
-
160
-
161
-
162
-
163
-
164
-
165
-
166
-
167
-
168
-
169
-
170
-
171
-
172
-
173
-
174
-
175
-
176
-
177
-
178
-
179
-
180
-
181
-
182
-
183
-
184
-
185
-
186
-
187
-
188
-
189
-
190
-
191
-
192
-
193
-
194
-
195
-
196
-
197
-
198
-
199
-
200
-
201
-
202
-
203
-
204
-
205
-
206
-
207
-
208
-
209
-
210
-
211
-
212
-
213
-
214
-
215
-
216
-
217
-
218
-
219
-
220
-
221
-
222
-
223
-
224
-
225
-
226
-
227
-
228
-
229
-
230
-
231
-
232
-
233
-
234
-
235
-
236
 |
 |

30
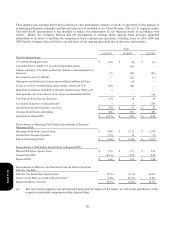
The Company uses earnings before Special Items as a key performance measure of results of operations for the purpose of
evaluating performance internally and Special Items are not included in our China Division, YRI or U.S. segment results.
This non-GAAP measurement is not intended to replace the presentation of our financial results in accordance with
GAAP. Rather, the Company believes that the presentation of earnings before Special Items provides additional
information to investors to facilitate the comparison of past and present operations, excluding items in 2010, 2009 and
2008 that the Company does not believe are indicative of our ongoing operations due to their size and/or nature.
Year
12/25/10 12/26/09 12/27/08
Detail of Special Items
U.S. Refranchising gain (loss) $ (18)
$ 34
$(5)
Long John Silver’s/A&W U.S. Goodwill impairment charge — (26) —
Charges relating to U.S. G&A productivity initiatives and realignment of
resources
(9)
(16)
(49)
Investments in our U.S. Brands — (32) (7)
Gain upon consolidation of a former unconsolidated affiliate in China — 68 —
Losses as a result of refranchising equity markets outside the U.S. (59)
(10) —
Depreciation reduction from KFC restaurants impaired upon offer to sell 9 — —
Gain upon the sale of our interest in our Japan unconsolidated affiliate — — 100
Total Special Items Income (Expense) (77) 18
39
Tax Benefit (Expense) on Special Items(a) 7 5
(14)
Special Items Income (Expense), net of tax $ (70) $ 23 $ 25
Average diluted shares outstanding 486 483 491
Special Items diluted EPS $ (0.15) $ 0.05 $ 0.05
Reconciliation of Operating Profit Before Special Items to Reported
Operating Profit
Operating Profit before Special Items $ 1,846 $ 1,572 $ 1,478
Special Items Income (Expense) (77) 18 39
Reported Operating Profit $ 1,769 $ 1,590 $ 1,517
Reconciliation of EPS Before Special Items to Reported EPS
Diluted EPS before Special Items $ 2.53 $ 2.17 $ 1.91
Special Items EPS (0.15) 0.05 0.05
Reported EPS $ 2.38 $ 2.22 $ 1.96
Reconciliation of Effective Tax Rate Before Special Items to Reported
Effective Tax Rate
Effective Tax Rate before Special Items 25.3% 23.1% 24.3%
Impact on Tax Rate as a result of Special Items(a) 0.8% (0.7)% 0.4%
Reported Effective Tax Rate 26.1% 22.4% 24.7%
(a) The tax benefit (expense) was determined based upon the impact of the nature, as well as the jurisdiction of the
respective individual components within Special Items.
Form 10-K