Pizza Hut 2010 Annual Report Download - page 123
Download and view the complete annual report
Please find page 123 of the 2010 Pizza Hut annual report below. You can navigate through the pages in the report by either clicking on the pages listed below, or by using the keyword search tool below to find specific information within the annual report.-
 1
1 -
2
-
3
-
4
-
5
-
6
-
7
-
8
-
9
-
10
-
11
-
12
-
13
-
14
-
15
-
16
-
17
-
18
-
19
-
20
-
21
-
22
-
23
-
24
-
25
-
26
-
27
-
28
-
29
-
30
-
31
-
32
-
33
-
34
-
35
-
36
-
37
-
38
-
39
-
40
-
41
-
42
-
43
-
44
-
45
-
46
-
47
-
48
-
49
-
50
-
51
-
52
-
53
-
54
-
55
-
56
-
57
-
58
-
59
-
60
-
61
-
62
-
63
-
64
-
65
-
66
-
67
-
68
-
69
-
70
-
71
-
72
-
73
-
74
-
75
-
76
-
77
-
78
-
79
-
80
-
81
-
82
-
83
-
84
-
85
-
86
-
87
-
88
-
89
-
90
-
91
-
92
-
93
-
94
-
95
-
96
-
97
-
98
-
99
-
100
-
101
-
102
-
103
-
104
-
105
-
106
-
107
-
108
-
109
-
110
-
111
-
112
-
 113
113 -
 114
114 -
 115
115 -
 116
116 -
 117
117 -
 118
118 -
 119
119 -
 120
120 -
 121
121 -
 122
122 -
 123
123 -
 124
124 -
 125
125 -
 126
126 -
 127
127 -
 128
128 -
 129
129 -
 130
130 -
 131
131 -
 132
132 -
 133
133 -
134
-
135
-
136
-
137
-
138
-
139
-
140
-
141
-
142
-
143
-
144
-
145
-
146
-
147
-
148
-
149
-
150
-
151
-
152
-
153
-
154
-
155
-
156
-
157
-
158
-
159
-
160
-
161
-
162
-
163
-
164
-
165
-
166
-
167
-
168
-
169
-
170
-
171
-
172
-
173
-
174
-
175
-
176
-
177
-
178
-
179
-
180
-
181
-
182
-
183
-
184
-
185
-
186
-
187
-
188
-
189
-
190
-
191
-
192
-
193
-
194
-
195
-
196
-
197
-
198
-
199
-
200
-
201
-
202
-
203
-
204
-
205
-
206
-
207
-
208
-
209
-
210
-
211
-
212
-
213
-
214
-
215
-
216
-
217
-
218
-
219
-
220
-
221
-
222
-
223
-
224
-
225
-
226
-
227
-
228
-
229
-
230
-
231
-
232
-
233
-
234
-
235
-
236
 |
 |

26
Segment Reporting Change
At the beginning of 2010 we began reporting information for our Thailand and KFC Taiwan businesses within our
International Division as a result of changes to our management reporting structure. These businesses now report to the
President of YRI, whereas previously they reported to the President of our China Division. While this reporting change
did not impact our consolidated results, segment information for previous periods has been restated to be consistent with
the current period presentation.
T
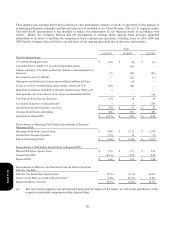
he following table summarizes the 2009 and 2008 increases to selected line items within the YRI segment as a result o
f
t
hese segment reporting changes (with equal and offsetting decreases impacting the China Division):
2009 2008
Company sales $ 270 $ 282
Company restaurant expenses 244 254
Operating Profit 6 9
Strategies
The Company continues to focus on four key strategies:
Build Leading Brands in China in Every Significant Category – The Company has developed the KFC and Pizza Hut
brands into the leading quick service and casual dining restaurants, respectively, in mainland China. Additionally, the
Company owns and operates the distribution system for its restaurants in mainland China which we believe provides a
significant competitive advantage. Given this strong competitive position, a growing economy and a population of 1.3
billion in mainland China, the Company is rapidly adding KFC and Pizza Hut Casual Dining restaurants and testing the
additional restaurant concepts of Pizza Hut Home Service (pizza delivery) and East Dawning (Chinese food). Our
ongoing earnings growth model in China includes double digit unit growth, same store sales growth of at least 4% and
leverage of our General and Administrative (“G&A”) infrastructure, which we expect to drive Operating Profit growth of
15%.
Drive Aggressive International Expansion and Build Strong Brands Everywhere – The Company and its franchisees
opened nearly 900 new restaurants in 2010 in the Company’s International Division, representing 11 straight years of
opening over 700 restaurants, and YRI is one of the leading international retail developers in terms of units opened. The
Company expects to continue to experience strong growth by building out existing markets and growing in new markets
including France, Russia and India. The International Division’s Operating Profit has experienced an 8 year compound
annual growth rate of 11%. Our ongoing earnings growth model for YRI includes Operating Profit growth of 10% driven
by 3-4% net unit growth, at least 2-3% same store sales growth, modest margin improvement and leverage of our G&A
infrastructure.
Dramatically Improve U.S. Brand Positions, Consistency and Returns – The Company continues to focus on improving its
U.S. position through differentiated products and marketing and an improved customer experience. The Company also
strives to provide industry leading new product innovation which adds sales layers and expands day parts. We continue to
evaluate our returns and ownership positions with an earn the right to own philosophy on Company owned restaurants.
Our ongoing earnings growth model calls for Operating Profit growth of 5% in the U.S. As we near completion of our
refranchising program in 2011, the Taco Bell operating segment will become an increasingly larger component of U.S.
ongoing earnings growth. The U.S. ongoing earnings growth model includes Taco Bell Operating Profit growth of 6%
driven by modest unit growth, same store sales growth of 3% and leverage of our G&A infrastructure.
Form 10-K