Pizza Hut 2010 Annual Report Download - page 197
Download and view the complete annual report
Please find page 197 of the 2010 Pizza Hut annual report below. You can navigate through the pages in the report by either clicking on the pages listed below, or by using the keyword search tool below to find specific information within the annual report.-
 1
1 -
2
-
3
-
4
-
5
-
6
-
7
-
8
-
9
-
10
-
11
-
12
-
13
-
14
-
15
-
16
-
17
-
18
-
19
-
20
-
21
-
22
-
23
-
24
-
25
-
26
-
27
-
28
-
29
-
30
-
31
-
32
-
33
-
34
-
35
-
36
-
37
-
38
-
39
-
40
-
41
-
42
-
43
-
44
-
45
-
46
-
47
-
48
-
49
-
50
-
51
-
52
-
53
-
54
-
55
-
56
-
57
-
58
-
59
-
60
-
61
-
62
-
63
-
64
-
65
-
66
-
67
-
68
-
69
-
70
-
71
-
72
-
73
-
74
-
75
-
76
-
77
-
78
-
79
-
80
-
81
-
82
-
83
-
84
-
85
-
86
-
87
-
88
-
89
-
90
-
91
-
92
-
93
-
94
-
95
-
96
-
97
-
98
-
99
-
100
-
101
-
102
-
103
-
104
-
105
-
106
-
107
-
108
-
109
-
110
-
111
-
112
-
113
-
114
-
115
-
116
-
117
-
118
-
119
-
120
-
121
-
122
-
123
-
124
-
125
-
126
-
127
-
128
-
129
-
130
-
131
-
132
-
133
-
134
-
135
-
136
-
137
-
138
-
139
-
140
-
141
-
142
-
143
-
144
-
145
-
146
-
147
-
148
-
149
-
150
-
151
-
152
-
153
-
154
-
155
-
156
-
157
-
158
-
159
-
160
-
161
-
162
-
163
-
164
-
165
-
166
-
167
-
168
-
169
-
170
-
171
-
172
-
173
-
174
-
175
-
176
-
177
-
178
-
179
-
180
-
181
-
182
-
183
-
184
-
185
-
186
-
 187
187 -
 188
188 -
 189
189 -
 190
190 -
 191
191 -
 192
192 -
 193
193 -
 194
194 -
 195
195 -
 196
196 -
 197
197 -
 198
198 -
 199
199 -
 200
200 -
 201
201 -
 202
202 -
 203
203 -
 204
204 -
 205
205 -
 206
206 -
 207
207 -
208
-
209
-
210
-
211
-
212
-
213
-
214
-
215
-
216
-
217
-
218
-
219
-
220
-
221
-
222
-
223
-
224
-
225
-
226
-
227
-
228
-
229
-
230
-
231
-
232
-
233
-
234
-
235
-
236
 |
 |

100
Retiree Medical Benefits
Our post-retirement plan provides health care benefits, principally to U.S. salaried retirees and their dependents, and
includes retiree cost sharing provisions. During 2001, the plan was amended such that any salaried employee hired or
rehired by YUM after September 30, 2001 is not eligible to participate in this plan. Employees hired prior to September
30, 2001 are eligible for benefits if they meet age and service requirements and qualify for retirement benefits. We fund
our post-retirement plan as benefits are paid.
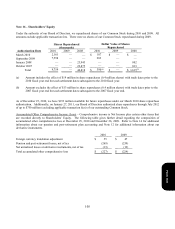
At the end of 2010 and 2009, the accumulated post-retirement benefit obligation was $78 million and $73 million,
respectively. The unrecognized actuarial loss recognized in Accumulated other comprehensive loss was $6 million at the
end of 2010 and less than $1 million at the end of 2009. The net periodic benefit cost recorded in 2010, 2009 and 2008
was $6 million, $7 million and $10 million, respectively, the majority of which is interest cost on the accumulated post-
retirement benefit obligation. 2010, 2009 and 2008 costs included less than $1 million, $1 million and $4 million,
respectively, of special termination benefits primarily related to the U.S. business transformation measures described in
Note 4. The weighted-average assumptions used to determine benefit obligations and net periodic benefit cost for the
post-retirement medical plan are identical to those as shown for the U.S. pension plans. Our assumed heath care cost
trend rates for the following year as of 2010 and 2009 are 7.7% and 7.8%, respectively, with expected ultimate trend rates
of 4.5% reached in 2028.
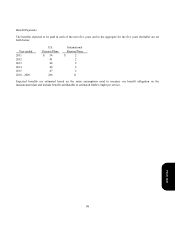
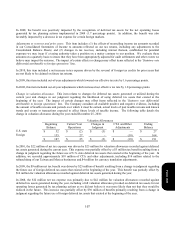
There is a cap on our medical liability for certain retirees. The cap for Medicare eligible retirees was reached in 2000 and
the cap for non-Medicare eligible retirees is expected to be reached in 2012; once the cap is reached, our annual cost per
retiree will not increase. A one-percentage-point increase or decrease in assumed health care cost trend rates would have
less than a $1 million impact on total service and interest cost and on the post-retirement benefit obligation. The benefits
expected to be paid in each of the next five years are approximately $7 million and in aggregate for the five years
thereafter are $30 million.
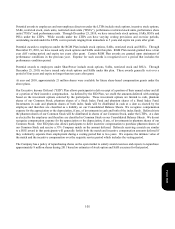
Retiree Savings Plan
We sponsor a contributory plan to provide retirement benefits under the provisions of Section 401(k) of the Internal
Revenue Code (the “401(k) Plan”) for eligible U.S. salaried and hourly employees. Participants are able to elect to
contribute up to 75% of eligible compensation on a pre-tax basis. Participants may allocate their contributions to one or
any combination of multiple investment options or a self-managed account within the 401(k) Plan. We match 100% of
the participant’s contribution to the 401(k) Plan up to 6% of eligible compensation. We recognized as compensation
expense our total matching contribution of $15 million in 2010 and $16 million in 2009 and 2008.
Note 15 – Share-based and Deferred Compensation Plans
Overview
At year end 2010, we had four stock award plans in effect: the YUM! Brands, Inc. Long-Term Incentive Plan and the
1997 Long-Term Incentive Plan (collectively the “LTIPs”), the YUM! Brands, Inc. Restaurant General Manager Stock
Option Plan (“RGM Plan”) and the YUM! Brands, Inc. SharePower Plan (“SharePower”). Under all our plans, the
exercise price of stock options and stock appreciation rights (“SARs”) granted must be equal to or greater than the average
market price or the ending market price of the Company’s stock on the date of grant.
Form 10-K