Pizza Hut 2010 Annual Report Download - page 199
Download and view the complete annual report
Please find page 199 of the 2010 Pizza Hut annual report below. You can navigate through the pages in the report by either clicking on the pages listed below, or by using the keyword search tool below to find specific information within the annual report.-
 1
1 -
2
-
3
-
4
-
5
-
6
-
7
-
8
-
9
-
10
-
11
-
12
-
13
-
14
-
15
-
16
-
17
-
18
-
19
-
20
-
21
-
22
-
23
-
24
-
25
-
26
-
27
-
28
-
29
-
30
-
31
-
32
-
33
-
34
-
35
-
36
-
37
-
38
-
39
-
40
-
41
-
42
-
43
-
44
-
45
-
46
-
47
-
48
-
49
-
50
-
51
-
52
-
53
-
54
-
55
-
56
-
57
-
58
-
59
-
60
-
61
-
62
-
63
-
64
-
65
-
66
-
67
-
68
-
69
-
70
-
71
-
72
-
73
-
74
-
75
-
76
-
77
-
78
-
79
-
80
-
81
-
82
-
83
-
84
-
85
-
86
-
87
-
88
-
89
-
90
-
91
-
92
-
93
-
94
-
95
-
96
-
97
-
98
-
99
-
100
-
101
-
102
-
103
-
104
-
105
-
106
-
107
-
108
-
109
-
110
-
111
-
112
-
113
-
114
-
115
-
116
-
117
-
118
-
119
-
120
-
121
-
122
-
123
-
124
-
125
-
126
-
127
-
128
-
129
-
130
-
131
-
132
-
133
-
134
-
135
-
136
-
137
-
138
-
139
-
140
-
141
-
142
-
143
-
144
-
145
-
146
-
147
-
148
-
149
-
150
-
151
-
152
-
153
-
154
-
155
-
156
-
157
-
158
-
159
-
160
-
161
-
162
-
163
-
164
-
165
-
166
-
167
-
168
-
169
-
170
-
171
-
172
-
173
-
174
-
175
-
176
-
177
-
178
-
179
-
180
-
181
-
182
-
183
-
184
-
185
-
186
-
187
-
188
-
 189
189 -
 190
190 -
 191
191 -
 192
192 -
 193
193 -
 194
194 -
 195
195 -
 196
196 -
 197
197 -
 198
198 -
 199
199 -
 200
200 -
 201
201 -
 202
202 -
 203
203 -
 204
204 -
 205
205 -
 206
206 -
 207
207 -
 208
208 -
 209
209 -
210
-
211
-
212
-
213
-
214
-
215
-
216
-
217
-
218
-
219
-
220
-
221
-
222
-
223
-
224
-
225
-
226
-
227
-
228
-
229
-
230
-
231
-
232
-
233
-
234
-
235
-
236
 |
 |

102
Award Valuation
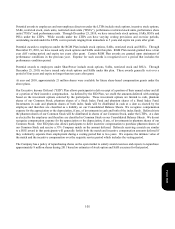
We estimated the fair value of each stock option and SAR award as of the date of grant using the Black-Scholes option-
pricing model with the following weighted-average assumptions:
2010 2009 2008
Risk-free interest rate 2.4
%
1.9% 3.0
%
Expected term (years) 6.0 5.9 6.0
Expected volatility 30.0
%
32.3% 30.9
%
Expected dividend yield 2.5
%
2.6% 1.7
%
We believe it is appropriate to group our stock option and SAR awards into two homogeneous groups when estimating
expected term. These groups consist of grants made primarily to restaurant-level employees under the RGM Plan, which
cliff vest after four years and expire ten years after grant, and grants made to executives under our other stock award
plans, which typically have a graded vesting schedule of 25% per year over four years and expire ten years after grant.
We use a single weighted-average term for our awards that have a graded vesting schedule. Based on analysis of our
historical exercise and post-vesting termination behavior, we have determined that our restaurant-level employees and our
executives exercised the awards on average after five years and six years, respectively.
When determining expected volatility, we consider both historical volatility of our stock as well as implied volatility
associated with our traded options. The expected dividend yield is based on the annual dividend yield at the time of grant.
The fair values of RSU and PSU awards are based on the closing price of our stock on the date of grant.
Form 10-K