Pizza Hut 2010 Annual Report Download - page 121
Download and view the complete annual report
Please find page 121 of the 2010 Pizza Hut annual report below. You can navigate through the pages in the report by either clicking on the pages listed below, or by using the keyword search tool below to find specific information within the annual report.-
 1
1 -
2
-
3
-
4
-
5
-
6
-
7
-
8
-
9
-
10
-
11
-
12
-
13
-
14
-
15
-
16
-
17
-
18
-
19
-
20
-
21
-
22
-
23
-
24
-
25
-
26
-
27
-
28
-
29
-
30
-
31
-
32
-
33
-
34
-
35
-
36
-
37
-
38
-
39
-
40
-
41
-
42
-
43
-
44
-
45
-
46
-
47
-
48
-
49
-
50
-
51
-
52
-
53
-
54
-
55
-
56
-
57
-
58
-
59
-
60
-
61
-
62
-
63
-
64
-
65
-
66
-
67
-
68
-
69
-
70
-
71
-
72
-
73
-
74
-
75
-
76
-
77
-
78
-
79
-
80
-
81
-
82
-
83
-
84
-
85
-
86
-
87
-
88
-
89
-
90
-
91
-
92
-
93
-
94
-
95
-
96
-
97
-
98
-
99
-
100
-
101
-
102
-
103
-
104
-
105
-
106
-
107
-
108
-
109
-
110
-
 111
111 -
 112
112 -
 113
113 -
 114
114 -
 115
115 -
 116
116 -
 117
117 -
 118
118 -
 119
119 -
 120
120 -
 121
121 -
 122
122 -
 123
123 -
 124
124 -
 125
125 -
 126
126 -
 127
127 -
 128
128 -
 129
129 -
 130
130 -
 131
131 -
132
-
133
-
134
-
135
-
136
-
137
-
138
-
139
-
140
-
141
-
142
-
143
-
144
-
145
-
146
-
147
-
148
-
149
-
150
-
151
-
152
-
153
-
154
-
155
-
156
-
157
-
158
-
159
-
160
-
161
-
162
-
163
-
164
-
165
-
166
-
167
-
168
-
169
-
170
-
171
-
172
-
173
-
174
-
175
-
176
-
177
-
178
-
179
-
180
-
181
-
182
-
183
-
184
-
185
-
186
-
187
-
188
-
189
-
190
-
191
-
192
-
193
-
194
-
195
-
196
-
197
-
198
-
199
-
200
-
201
-
202
-
203
-
204
-
205
-
206
-
207
-
208
-
209
-
210
-
211
-
212
-
213
-
214
-
215
-
216
-
217
-
218
-
219
-
220
-
221
-
222
-
223
-
224
-
225
-
226
-
227
-
228
-
229
-
230
-
231
-
232
-
233
-
234
-
235
-
236
 |
 |

24
Fiscal years 2010, 2009, 2008, 2007 and 2006 all include 52 weeks.
The selected financial data should be read in conjunction with the Consolidated Financial Statements and the Notes
thereto.
(a) Fiscal year 2009 included non-cash charges of $26 million and $12 million to write-off goodwill related to our
LJS/A&W U.S. and Pizza Hut South Korea businesses, respectively. See Note 4 to the Consolidated Financial
Statements for a description of our store closures and store impairment expenses in 2010, 2009 and 2008.
Additionally, see Note 9 describing our goodwill impairment expense recognized in 2009.
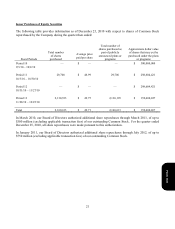
(b) Fiscal year 2010 included U.S. refranchising losses of $18 million, a loss upon refranchising our Mexico market
of $52 million and a loss upon refranchising our Taiwan market of $7 million. Fiscal year 2009 included U.S.
refranchising gains of $34 million and a loss of $10 million as a result of our decision to offer to refranchise our
Taiwan market. These items are discussed further within our MD&A.
(c) Fiscal year 2010 included a loss of $18 million related to U.S. business transformation measures, including the
2010 U.S. refranchising losses, and the 2010 Mexico and Taiwan refranchising losses described in (b). Fiscal
year 2009 included a gain of $68 million related to the consolidation of a former unconsolidated affiliate in
China, a loss of $40 million related to U.S. business transformation measures, including the $26 million
goodwill charge described in (a) and the 2009 U.S. refranchising gains described in (b), and the 2009 Taiwan
refranchising loss described in (b). Fiscal year 2008 included a gain of $100 million related to the sale of our
interest in our unconsolidated affiliate in Japan and a loss of $61 million related to U.S. business transformation
measures. These items are discussed further within our MD&A.
(d) Adjusted for the two for one stock split on June 26, 2007.
(e) In addition to the results provided in accordance with U.S. Generally Accepted Accounting Principles (“GAAP”)
throughout this document, the Company has provided non-GAAP measurements which present operating results
on a basis before Special Items. The Company uses earnings before Special Items as a key performance measure
of results of operations for the purpose of evaluating performance internally. This non-GAAP measurement is
not intended to replace the presentation of our financial results in accordance with GAAP. Rather, the Company
believes that the presentation of earnings before Special Items provides additional information to investors to
facilitate the comparison of past and present operations, excluding items that the Company does not believe are
indicative of our ongoing operations due to their size and/or nature. The gains and charges described in (c),
above, are considered Special Items. The 2010, 2009 and 2008 Special Items are discussed in further detail
within the MD&A.
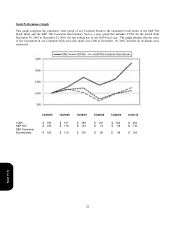
(f) System sales growth includes the results of all restaurants regardless of ownership, including Company owned,
franchise, unconsolidated affiliate and license restaurants. Sales of franchise, unconsolidated affiliate and
license restaurants generate franchise and license fees for the Company (typically at a rate of 4% to 6% of sales).
Franchise, unconsolidated affiliate and license restaurant sales are not included in Company sales on the
Consolidated Statements of Income; however, the franchise and license fees are included in the Company’s
revenues. We believe system sales growth is useful to investors as a significant indicator of the overall strength
of our business as it incorporates all our revenue drivers, Company and franchise same store sales as well as net
unit development. Same store sales growth includes the results of all restaurants that have been open one year or
more.
(g) Local currency represents the percentage change excluding the impact of foreign currency translation. These
amounts are derived by translating current year results at prior year average exchange rates. We believe the
elimination of the foreign currency translation impact provides better year-to-year comparability without the
distortion of foreign currency fluctuations.
Form 10-K