Pizza Hut 2010 Annual Report Download - page 173
Download and view the complete annual report
Please find page 173 of the 2010 Pizza Hut annual report below. You can navigate through the pages in the report by either clicking on the pages listed below, or by using the keyword search tool below to find specific information within the annual report.-
 1
1 -
2
-
3
-
4
-
5
-
6
-
7
-
8
-
9
-
10
-
11
-
12
-
13
-
14
-
15
-
16
-
17
-
18
-
19
-
20
-
21
-
22
-
23
-
24
-
25
-
26
-
27
-
28
-
29
-
30
-
31
-
32
-
33
-
34
-
35
-
36
-
37
-
38
-
39
-
40
-
41
-
42
-
43
-
44
-
45
-
46
-
47
-
48
-
49
-
50
-
51
-
52
-
53
-
54
-
55
-
56
-
57
-
58
-
59
-
60
-
61
-
62
-
63
-
64
-
65
-
66
-
67
-
68
-
69
-
70
-
71
-
72
-
73
-
74
-
75
-
76
-
77
-
78
-
79
-
80
-
81
-
82
-
83
-
84
-
85
-
86
-
87
-
88
-
89
-
90
-
91
-
92
-
93
-
94
-
95
-
96
-
97
-
98
-
99
-
100
-
101
-
102
-
103
-
104
-
105
-
106
-
107
-
108
-
109
-
110
-
111
-
112
-
113
-
114
-
115
-
116
-
117
-
118
-
119
-
120
-
121
-
122
-
123
-
124
-
125
-
126
-
127
-
128
-
129
-
130
-
131
-
132
-
133
-
134
-
135
-
136
-
137
-
138
-
139
-
140
-
141
-
142
-
143
-
144
-
145
-
146
-
147
-
148
-
149
-
150
-
151
-
152
-
153
-
154
-
155
-
156
-
157
-
158
-
159
-
160
-
161
-
162
-
 163
163 -
 164
164 -
 165
165 -
 166
166 -
 167
167 -
 168
168 -
 169
169 -
 170
170 -
 171
171 -
 172
172 -
 173
173 -
 174
174 -
 175
175 -
 176
176 -
 177
177 -
 178
178 -
 179
179 -
 180
180 -
 181
181 -
 182
182 -
 183
183 -
184
-
185
-
186
-
187
-
188
-
189
-
190
-
191
-
192
-
193
-
194
-
195
-
196
-
197
-
198
-
199
-
200
-
201
-
202
-
203
-
204
-
205
-
206
-
207
-
208
-
209
-
210
-
211
-
212
-
213
-
214
-
215
-
216
-
217
-
218
-
219
-
220
-
221
-
222
-
223
-
224
-
225
-
226
-
227
-
228
-
229
-
230
-
231
-
232
-
233
-
234
-
235
-
236
 |
 |

76
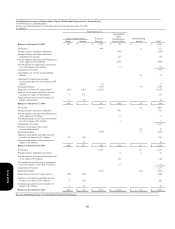
Common Stock Share Repurchases. From time to time, we repurchase shares of our Common Stock under share
repurchase programs authorized by our Board of Directors. Shares repurchased constitute authorized, but unissued shares
under the North Carolina laws under which we are incorporated. Additionally, our Common Stock has no par or stated
value. Accordingly, we record the full value of share repurchases, upon the trade date, against Common Stock on our
Consolidated Balance Sheet except when to do so would result in a negative balance in such Common Stock account. In
such instances, on a period basis, we record the cost of any further share repurchases as a reduction in retained earnings.
Due to the large number of share repurchases and the increase in the market value of our stock over the past several years,
our Common Stock balance is frequently zero at the end of any period. Our Common Stock balance was such that no
share repurchases impacted Retained Earnings in 2010, while $1,434 million in share repurchases were recorded as a
reduction in Retained Earnings in 2008. There were no shares of our Common Stock repurchased during 2009. See Note
16 for additional information.
Pension and Post-retirement Medical Benefits. We measure and recognize the overfunded or underfunded status of our
pension and post-retirement plans as an asset or liability in our Consolidated Balance Sheet as of our fiscal year end. The
funded status represents the difference between the projected benefit obligation and the fair value of plan assets. The
projected benefit obligation is the present value of benefits earned to date by plan participants, including the effect of
future salary increases, as applicable. The difference between the projected benefit obligation and the fair value of assets
that has not previously been recognized as expense is recorded as a component of Accumulated other comprehensive
income (loss).
Note 3 – Earnings Per Common Share (“EPS”)
2010 2009 2008
N
et Income – YUM! Brands, Inc.
$
1,158 $ 1,071 $ 964
Weighted-average common shares outstanding (for basic
calculation) 474 471 475
Effect of dilutive share-based employee compensation 12 12 16
Weighted-average common and dilutive potential common shares
outstanding (for diluted calculation) 486 483 491
Basic EPS
$
2.44 $ 2.28 $ 2.03
Diluted EPS
$
2.38 $ 2.22 $ 1.96
Unexercised employee stock options and stock appreciation rights
(in millions) excluded from the diluted EPS computation(a) 2.2 13.3 5.9
(a) These unexercised employee stock options and stock appreciation rights were not included in the computation of
diluted EPS because to do so would have been antidilutive for the periods presented.
Form 10-K