OfficeMax 2005 Annual Report Download - page 63
Download and view the complete annual report
Please find page 63 of the 2005 OfficeMax annual report below. You can navigate through the pages in the report by either clicking on the pages listed below, or by using the keyword search tool below to find specific information within the annual report.-
 1
1 -
2
-
3
-
4
-
5
-
6
-
7
-
8
-
9
-
10
-
11
-
12
-
13
-
14
-
15
-
16
-
17
-
18
-
19
-
20
-
21
-
22
-
23
-
24
-
25
-
26
-
27
-
28
-
29
-
30
-
31
-
32
-
33
-
34
-
35
-
36
-
37
-
38
-
39
-
40
-
41
-
42
-
43
-
44
-
45
-
46
-
47
-
48
-
49
-
50
-
51
-
52
-
 53
53 -
 54
54 -
 55
55 -
 56
56 -
 57
57 -
 58
58 -
 59
59 -
 60
60 -
 61
61 -
 62
62 -
 63
63 -
 64
64 -
 65
65 -
 66
66 -
 67
67 -
 68
68 -
 69
69 -
 70
70 -
 71
71 -
 72
72 -
 73
73 -
74
-
75
-
76
-
77
-
78
-
79
-
80
-
81
-
82
-
83
-
84
-
85
-
86
-
87
-
88
-
89
-
90
-
91
-
92
-
93
-
94
-
95
-
96
-
97
-
98
-
99
-
100
-
101
-
102
-
103
-
104
-
105
-
106
-
107
-
108
-
109
-
110
-
111
-
112
-
113
-
114
-
115
-
116
-
117
-
118
-
119
-
120
-
121
-
122
-
123
-
124
-
125
-
126
-
127
-
128
-
129
-
130
-
131
-
132
 |
 |

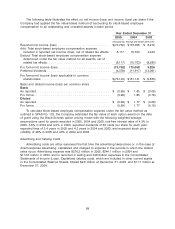
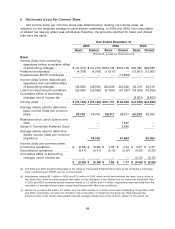
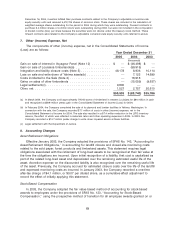
The following table illustrates the effect on net income (loss) and income (loss) per share if the
Company had applied the fair value-based method of accounting for stock-based employee
compensation to all outstanding and unvested awards in each period.
Year Ended December 31
2005 2004 2003
(thousands, except per-share amounts)
Reported net income (loss) ............................ $(73,762) $173,058 $ 8,272
Add: Total stock-based employee compensation expense
included in reported net income (loss), net of related tax effects 6,117 15,703 4,234
Deduct: Total stock-based employee compensation expense
determined under the fair value method for all awards, net of
related tax effects .................................. (6,117) (15,703) (9,280)
Pro forma net income (loss) ............................ (73,762) 173,058 3,226
Preferred dividends .................................. (4,378) (11,917) (13,061)
Pro forma net income (loss) applicable to common
shareholders ..................................... $(78,140) $161,141 $ (9,835)
Basic and diluted income (loss) per common share
Basic
As reported ........................................ $ (0.99) $ 1.85 $ (0.08)
Pro forma ......................................... (0.99) 1.85 (0.16)
Diluted
As reported ........................................ $ (0.99) $ 1.77 $ (0.08)
Pro forma ......................................... (0.99) 1.77 (0.16)
To calculate stock-based employee compensation expense under the fair value method as
outlined in SFAS No. 123, the Company estimated the fair value of each option award on the date
of grant using the Black-Scholes option pricing model with the following weighted-average
assumptions used for grants awarded in 2005, 2004 and 2003: risk-free interest rates of 4.3% in
2005, 3.6% in 2004 and 4.0% in 2003; expected dividends of 60 cents per share for each year;
expected lives of 3.4 years in 2005 and 4.3 years in 2004 and 2003; and expected stock price
volatility of 28% in 2005 and 40% in 2004 and 2003.
Advertising and Catalog Costs
Advertising costs are either expensed the first time the advertising takes place or, in the case of
direct-response advertising, capitalized and charged to expense in the periods in which the related
sales occur. Advertising expense was $276.2 million in 2005, $344.1 million in 2004 and
$113.6 million in 2003, and is recorded in selling and distribution expenses in the Consolidated
Statements of Income (Loss). Capitalized catalog costs, which are included in other current assets
in the Consolidated Balance Sheets, totaled $9.9 million at December 31, 2005, and $11.7 million at
December 31, 2004.
59