OfficeMax 2005 Annual Report Download - page 24
Download and view the complete annual report
Please find page 24 of the 2005 OfficeMax annual report below. You can navigate through the pages in the report by either clicking on the pages listed below, or by using the keyword search tool below to find specific information within the annual report.-
 1
1 -
2
-
3
-
4
-
5
-
6
-
7
-
8
-
9
-
10
-
11
-
12
-
13
-
 14
14 -
 15
15 -
 16
16 -
 17
17 -
 18
18 -
 19
19 -
 20
20 -
 21
21 -
 22
22 -
 23
23 -
 24
24 -
 25
25 -
 26
26 -
 27
27 -
 28
28 -
 29
29 -
 30
30 -
 31
31 -
 32
32 -
 33
33 -
 34
34 -
35
-
36
-
37
-
38
-
39
-
40
-
41
-
42
-
43
-
44
-
45
-
46
-
47
-
48
-
49
-
50
-
51
-
52
-
53
-
54
-
55
-
56
-
57
-
58
-
59
-
60
-
61
-
62
-
63
-
64
-
65
-
66
-
67
-
68
-
69
-
70
-
71
-
72
-
73
-
74
-
75
-
76
-
77
-
78
-
79
-
80
-
81
-
82
-
83
-
84
-
85
-
86
-
87
-
88
-
89
-
90
-
91
-
92
-
93
-
94
-
95
-
96
-
97
-
98
-
99
-
100
-
101
-
102
-
103
-
104
-
105
-
106
-
107
-
108
-
109
-
110
-
111
-
112
-
113
-
114
-
115
-
116
-
117
-
118
-
119
-
120
-
121
-
122
-
123
-
124
-
125
-
126
-
127
-
128
-
129
-
130
-
131
-
132
 |
 |

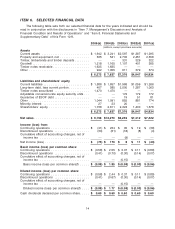
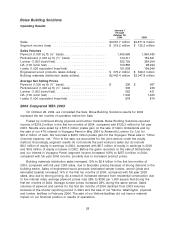
Results of Operations, Consolidated
($ in millions, except per share amounts)
2005 2004 2003
Sales ............................................ $9,157.7 $13,270.2 $8,245.1
Income (loss) before cumulative effect of accounting changes . . . $ (73.8) $ 173.1 $ 17.1
Cumulative effect of accounting changes, net of income tax .... $ — $ — $ (8.8)
Net income (loss) ................................... $ (73.8) $ 173.1 $ 8.3
Diluted income (loss) per common share
Diluted before cumulative effect of accounting changes ........ $ (0.99) $ 1.77 $ 0.07
Cumulative effect of accounting changes, net of income tax .... — — (0.15)
Diluted income (loss) per common share ................ $ (0.99) $ 1.77 $ (0.08)
(percentage of sales)
Materials, labor and other operating expenses .............. 75.6% 78.1% 80.3%
Selling and distribution expenses ........................ 18.9% 14.7% 11.5%
General and administrative expenses ..................... 3.2% 2.3% 1.9%
Operating Results
2005 Compared with 2004
In 2005, sales were $9.2 billion, compared with $13.3 billion in 2004. The sales decline in 2005
was primarily due to sales of our Boise Building Solutions and Boise Paper Solutions segments that
were included in 2004 but not in 2005. Substantially all of the assets of these segments, along with
our timberland assets, were included in the Sale. For more information about our segment results,
see the discussion of segment results below.
In 2005, materials, labor and other operating expenses as a percentage of sales decreased to
75.6% from 78.1% in 2004, while selling and distribution expenses increased to 18.9% of sales
compared to 14.7% of sales in 2004. The year-over-year variances are largely attributable to the
Sale. The Contract and Retail segments operate with both higher gross margins and higher selling
and distribution expenses than the Boise Building Solutions and Boise Paper Solutions segments.
As a percentage of sales, general and administrative expenses for 2005 increased to 3.2% from
2.3% in 2004. Results for 2005 included charges of $24.2 million primarily due to one-time
severance payments and higher costs related to employee retirement benefits and retention
programs as well as expenses related to the transition of support staff services from Boise
Cascade, L.L.C. to OfficeMax Incorporated.
In 2005, we reported $59.5 million of expense in ‘‘Other (income) expense, net,’’ including
$25.0 million of expenses related to the relocation and consolidation of our corporate headquarters,
$23.2 million of expenses for the write-down of impaired assets related to underperforming retail
stores and the restructuring of our Canadian operations and a $9.8 million pretax charge related to
a settlement with the Department of Justice.
20