OfficeMax 2005 Annual Report Download - page 32
Download and view the complete annual report
Please find page 32 of the 2005 OfficeMax annual report below. You can navigate through the pages in the report by either clicking on the pages listed below, or by using the keyword search tool below to find specific information within the annual report.-
 1
1 -
2
-
3
-
4
-
5
-
6
-
7
-
8
-
9
-
10
-
11
-
12
-
13
-
14
-
15
-
16
-
17
-
18
-
19
-
20
-
21
-
 22
22 -
 23
23 -
 24
24 -
 25
25 -
 26
26 -
 27
27 -
 28
28 -
 29
29 -
 30
30 -
 31
31 -
 32
32 -
 33
33 -
 34
34 -
 35
35 -
 36
36 -
 37
37 -
 38
38 -
 39
39 -
 40
40 -
 41
41 -
 42
42 -
43
-
44
-
45
-
46
-
47
-
48
-
49
-
50
-
51
-
52
-
53
-
54
-
55
-
56
-
57
-
58
-
59
-
60
-
61
-
62
-
63
-
64
-
65
-
66
-
67
-
68
-
69
-
70
-
71
-
72
-
73
-
74
-
75
-
76
-
77
-
78
-
79
-
80
-
81
-
82
-
83
-
84
-
85
-
86
-
87
-
88
-
89
-
90
-
91
-
92
-
93
-
94
-
95
-
96
-
97
-
98
-
99
-
100
-
101
-
102
-
103
-
104
-
105
-
106
-
107
-
108
-
109
-
110
-
111
-
112
-
113
-
114
-
115
-
116
-
117
-
118
-
119
-
120
-
121
-
122
-
123
-
124
-
125
-
126
-
127
-
128
-
129
-
130
-
131
-
132
 |
 |

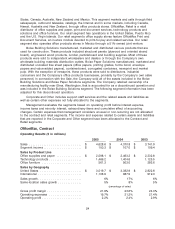
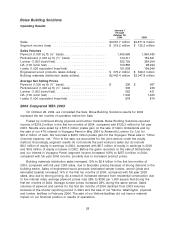
Boise Building Solutions
Operating Results
January 1
through
October 28,
2004 2003
Sales .......................................... $3,257.7 million $2,871.9 million
Segment income (loss) ............................. $ 319.2 million $ 125.3 million
Sales Volumes
Plywood (1,000 sq ft) (3⁄8’’ basis) ....................... 1,465,965 1,890,480
Particleboard (1,000 sq ft) (3⁄4’’ basis) ................... 134,411 152,621
Lumber (1,000 board feet) ........................... 302,725 364,054
LVL (100 cubic feet) ................................ 100,855 98,294
I-joists (1,000 equivalent lineal feet) ..................... 191,938 199,949
Engineered wood products (sales dollars) ................ $ 375.2 million $ 329.3 million
Building materials distribution (sales dollars) .............. $2,442.4 million $2,047.8 million
Average Net Selling Prices
Plywood (1,000 sq ft) (3⁄8’’ basis) ....................... $ 336 $ 267
Particleboard (1,000 sq ft) (3⁄4’’ basis) ................... 305 236
Lumber (1,000 board feet) ........................... 552 431
LVL (100 cubic feet) ................................ 1,640 1,463
I-joists (1,000 equivalent lineal feet) ..................... 978 874
2004 Compared With 2003
On October 29, 2004, we completed the Sale. Boise Building Solutions results for 2004
represent the ten months of operation before the Sale.
Fueled by continued strong plywood and lumber markets, Boise Building Solutions reported
income of $319.2 million in the first ten months of 2004, compared with $125.3 million for full year
2003. Results were aided by a $15.3 million pretax gain on the sale of Idaho timberlands and by
the sale of our 47% interest in Voyageur Panel in May 2004 to Ainsworth Lumber Co. Ltd. for
$91.2 million of cash. We recorded a $46.5 million pretax gain for the Voyageur Panel sale in ‘‘Other
(income) expense, net.’’ Prior to the sale, we accounted for the joint venture under the equity
method. Accordingly, segment results do not include the joint venture’s sales but do include
$6.3 million of equity in earnings in 2004, compared with $8.7 million of equity in earnings in 2003
and $0.6 million of equity in losses in 2002. Before the gains recorded on the sale of timberlands
and our interest in Voyageur Panel, segment income increased 105% to $257.4 million in 2004,
compared with full year 2003 income, primarily due to increased product prices.
Building materials distribution sales increased 19% to $2.4 billion in the first ten months of
2004, compared with full year 2003 sales, due to favorable pricing because of strong demand in the
building sector. Sales of engineered wood products (laminated veneer lumber, wood I-joists and
laminated beams) increased 14% in the first ten months of 2004, compared with full year 2003
sales, also due to strong pricing. As a result of increased demand from residential construction due
to low interest rates, average plywood prices rose 26% to $336 per 1,000 square feet during the
first ten months of 2004. Average lumber prices increased 28% during the same period. Sales
volumes of plywood and lumber for the first ten months of 2004 declined from 2003 volumes
because of the shorter reporting period in 2004 and the sale of our Yakima, Washington, plywood
and lumber facilities in February 2004. The sale of our Yakima facilities did not have a material
impact on our financial position or results of operations.
28