OfficeMax 2005 Annual Report Download - page 38
Download and view the complete annual report
Please find page 38 of the 2005 OfficeMax annual report below. You can navigate through the pages in the report by either clicking on the pages listed below, or by using the keyword search tool below to find specific information within the annual report.-
 1
1 -
2
-
3
-
4
-
5
-
6
-
7
-
8
-
9
-
10
-
11
-
12
-
13
-
14
-
15
-
16
-
17
-
18
-
19
-
20
-
21
-
22
-
23
-
24
-
25
-
26
-
27
-
 28
28 -
 29
29 -
 30
30 -
 31
31 -
 32
32 -
 33
33 -
 34
34 -
 35
35 -
 36
36 -
 37
37 -
 38
38 -
 39
39 -
 40
40 -
 41
41 -
 42
42 -
 43
43 -
 44
44 -
 45
45 -
 46
46 -
 47
47 -
 48
48 -
49
-
50
-
51
-
52
-
53
-
54
-
55
-
56
-
57
-
58
-
59
-
60
-
61
-
62
-
63
-
64
-
65
-
66
-
67
-
68
-
69
-
70
-
71
-
72
-
73
-
74
-
75
-
76
-
77
-
78
-
79
-
80
-
81
-
82
-
83
-
84
-
85
-
86
-
87
-
88
-
89
-
90
-
91
-
92
-
93
-
94
-
95
-
96
-
97
-
98
-
99
-
100
-
101
-
102
-
103
-
104
-
105
-
106
-
107
-
108
-
109
-
110
-
111
-
112
-
113
-
114
-
115
-
116
-
117
-
118
-
119
-
120
-
121
-
122
-
123
-
124
-
125
-
126
-
127
-
128
-
129
-
130
-
131
-
132
 |
 |

Investment Activities
Our cash investing activities used $97.3 million in 2005, provided $1.6 billion in 2004 and used
$673.6 million in 2003. The year-over-year fluctuations in cash from investing activities were
primarily due to the Sale in 2004 and the Acquisition in 2003.
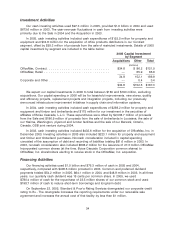
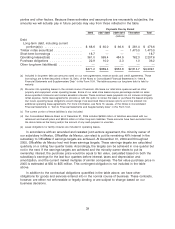
In 2005, cash investing activities included cash expenditures of $152.5 million for property and
equipment and $34.8 million for the acquisition of office products distributors in our Contract
segment, offset by $93.3 million of proceeds from the sale of restricted investments. Details of 2005
capital investment by segment are included in the table below:
2005 Capital Investment
by Segment
Acquisitions Other Total
(millions)
OfficeMax, Contract .................................. $34.8 $ 86.2 $121.0
OfficeMax, Retail .................................... — 65.9 65.9
34.8 152.1 186.9
Corporate and Other ................................. — 0.4 0.4
$34.8 $152.5 $187.3
We expect our capital investments in 2006 to total between $180 and $190 million, excluding
acquisitions. Our capital spending in 2006 will be for leasehold improvements, new stores, quality
and efficiency projects, replacement projects and integration projects, including our previously
announced infrastructure improvement initiatives in supply chain and information systems.
In 2004, cash investing activities included cash expenditures of $298.2 million for property and
equipment and timber and timberlands and $175 million for our investment in the securities of
affiliates of Boise Cascade, L.L.C. These expenditures were offset by $2,038.7 million of proceeds
from the Sale and $186.9 million of proceeds from the sale of timberlands in Louisiana, the sale of
our Yakima, Washington, plywood and lumber facilities and the sale of our Barwick, Ontario,
Canada, OSB joint venture during 2004.
In 2003, cash investing activities included $432.6 million for the acquisition of OfficeMax, Inc. in
December 2003. Investing activities in 2003 also included $223.1 million for property and equipment
and timber and timberland purchases. Noncash consideration included in capital spending
consisted of the assumption of debt and recording of liabilities totaling $81.6 million in 2003. In
2003, noncash consideration also included $808.2 million for the issuance of 27.3 million OfficeMax
Incorporated common shares (at the time, Boise Cascade Corporation common shares) to
OfficeMax, Inc. shareholders electing to receive stock in the OfficeMax, Inc. acquisition.
Financing Activities
Our financing activities used $1.0 billion and $76.3 million of cash in 2005 and 2004,
respectively, compared with $408.6 million provided in 2003. Common and preferred dividend
payments totaled $54.2 million in 2005, $64.1 million in 2004, and $48.9 million in 2003. In all three
years, our quarterly cash dividend was 15 cents per common share. In 2005, we used
$780.4 million of cash for the repurchase of 23.5 million shares of our common stock and used
$198.7 million of cash to reduce short-term borrowings and long-term debt.
On September 23, 2005, Standard & Poor’s Rating Services downgraded our corporate credit
rating to B+. The downgrade increases the reporting requirements under our receivable sale
agreement and increases the annual cost of that facility by less than $1 million.
34