OfficeMax 2005 Annual Report Download - page 28
Download and view the complete annual report
Please find page 28 of the 2005 OfficeMax annual report below. You can navigate through the pages in the report by either clicking on the pages listed below, or by using the keyword search tool below to find specific information within the annual report.-
 1
1 -
2
-
3
-
4
-
5
-
6
-
7
-
8
-
9
-
10
-
11
-
12
-
13
-
14
-
15
-
16
-
17
-
 18
18 -
 19
19 -
 20
20 -
 21
21 -
 22
22 -
 23
23 -
 24
24 -
 25
25 -
 26
26 -
 27
27 -
 28
28 -
 29
29 -
 30
30 -
 31
31 -
 32
32 -
 33
33 -
 34
34 -
 35
35 -
 36
36 -
 37
37 -
 38
38 -
39
-
40
-
41
-
42
-
43
-
44
-
45
-
46
-
47
-
48
-
49
-
50
-
51
-
52
-
53
-
54
-
55
-
56
-
57
-
58
-
59
-
60
-
61
-
62
-
63
-
64
-
65
-
66
-
67
-
68
-
69
-
70
-
71
-
72
-
73
-
74
-
75
-
76
-
77
-
78
-
79
-
80
-
81
-
82
-
83
-
84
-
85
-
86
-
87
-
88
-
89
-
90
-
91
-
92
-
93
-
94
-
95
-
96
-
97
-
98
-
99
-
100
-
101
-
102
-
103
-
104
-
105
-
106
-
107
-
108
-
109
-
110
-
111
-
112
-
113
-
114
-
115
-
116
-
117
-
118
-
119
-
120
-
121
-
122
-
123
-
124
-
125
-
126
-
127
-
128
-
129
-
130
-
131
-
132
 |
 |

States, Canada, Australia, New Zealand and Mexico. This segment markets and sells through field
salespeople, outbound telesales, catalogs, the Internet and in some markets, including Canada,
Hawaii, Australia and New Zealand, through office products stores. OfficeMax, Retail is a retail
distributor of office supplies and paper, print and document services, technology products and
solutions and office furniture. Our retail segment has operations in the United States, Puerto Rico
and the U.S. Virgin Islands. Our retail segment’s office supply stores feature OfficeMax Print and
Document Services, an in-store module devoted to print-for-pay and related services. Our retail
segment also operates office products stores in Mexico through a 51%-owned joint venture.
Boise Building Solutions manufactured, marketed and distributed various products that are
used for construction. These products included structural panels (plywood and oriented strand
board), engineered wood products, lumber, particleboard and buidling supplies. Most of these
products were sold to independent wholesalers and dealers or through the Company’s own
wholesale building materials distribution outlets. Boise Paper Solutions manufactured, marketed and
distributed uncoated free sheet papers (office papers, printing grades, forms bond, envelope
papers and value-added papers), containerboard, corrugated containers, newsprint and market
pulp. With the exception of newsprint, these products were sold to distributors, industrial
consumers and the Company’s office products businesses, primarily by the Company’s own sales
personnel. In connection with the Sale, the Company sold all of the assets included in the Boise
Building Solutions and Boise Paper Solutions segments. The Company retained ownership of a
manufacturing facility near Elma, Washington, that is accounted for as a discontinued operation and
was included in the Boise Building Solutions segment. The following segment information has been
adjusted for this discontinued operation.
Corporate and Other includes support staff services and the related assets and liabilities as
well as certain other expenses not fully allocated to the segments.
Management evaluates the segments based on operating profit before interest expense,
income taxes and minority interest, extraordinary items and cumulative effect of accounting
changes. Certain expenses that management considers unusual or non-recurring are not allocated
to the contract and retail segments. The income and expense related to certain assets and liabilities
that are reported in the Corporate and Other segment have been allocated to the Contract and
Retail segments.
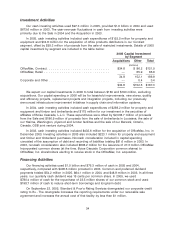
OfficeMax, Contract
Operating Results ($ in millions)
2005 2004 2003
Sales ............................. $ 4,628.6 $ 4,370.8 $ 3,741.9
Segment income ..................... $ 100.3 $ 107.0 $ 109.4
Sales by Product Line
Office supplies and paper .............. $ 2,598.1 $ 2,463.2 $ 2,232.8
Technology products .................. 1,469.2 1,404.6 1,125.5
Office furniture ...................... 561.3 503.0 383.6
Sales by Geography
United States ....................... $ 3,519.7 $ 3,382.9 $ 2,822.6
International ........................ 1,108.9 987.9 919.3
Sales growth ........................ 6% 17% 6%
Same-location sales growth ............. 5% 8% 5%
(percentage of sales)
Gross profit margin ................... 21.9% 23.6% 24.3%
Operating expenses .................. 19.7% 21.2% 21.4%
Operating profit ...................... 2.2% 2.4% 2.9%
24