OfficeMax 2005 Annual Report Download - page 26
Download and view the complete annual report
Please find page 26 of the 2005 OfficeMax annual report below. You can navigate through the pages in the report by either clicking on the pages listed below, or by using the keyword search tool below to find specific information within the annual report.-
 1
1 -
2
-
3
-
4
-
5
-
6
-
7
-
8
-
9
-
10
-
11
-
12
-
13
-
14
-
15
-
 16
16 -
 17
17 -
 18
18 -
 19
19 -
 20
20 -
 21
21 -
 22
22 -
 23
23 -
 24
24 -
 25
25 -
 26
26 -
 27
27 -
 28
28 -
 29
29 -
 30
30 -
 31
31 -
 32
32 -
 33
33 -
 34
34 -
 35
35 -
 36
36 -
37
-
38
-
39
-
40
-
41
-
42
-
43
-
44
-
45
-
46
-
47
-
48
-
49
-
50
-
51
-
52
-
53
-
54
-
55
-
56
-
57
-
58
-
59
-
60
-
61
-
62
-
63
-
64
-
65
-
66
-
67
-
68
-
69
-
70
-
71
-
72
-
73
-
74
-
75
-
76
-
77
-
78
-
79
-
80
-
81
-
82
-
83
-
84
-
85
-
86
-
87
-
88
-
89
-
90
-
91
-
92
-
93
-
94
-
95
-
96
-
97
-
98
-
99
-
100
-
101
-
102
-
103
-
104
-
105
-
106
-
107
-
108
-
109
-
110
-
111
-
112
-
113
-
114
-
115
-
116
-
117
-
118
-
119
-
120
-
121
-
122
-
123
-
124
-
125
-
126
-
127
-
128
-
129
-
130
-
131
-
132
 |
 |
In 2004, net income included a $67.8 million pretax charge for the write-down of our Elma,
Washington, manufacturing facility.
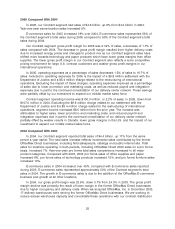
2004 Compared With 2003
Total sales for 2004 increased 60.9% to $13.3 billion, compared with $8.2 billion in 2003. Sales
increased primarily because of the OfficeMax, Inc., acquisition in December 2003, strong sales
growth in our OfficeMax, Contract segment and improved product prices in the Boise Building
Solutions segment.
In 2004, materials, labor and other operating expenses were 78.1% of sales, compared to
80.3% of sales in 2004. The improved leverage of materials, labor and operating expenses is largely
attributable to the acquired retail office products business’s higher gross margins. Excluding the
impact of our retail office products business, materials, labor and other operating expenses as a
percentage of sales declined by less than 1% of sales, primarily as a result of improved product
prices in Boise Building Solutions.
Selling and distribution expenses increased to 14.7% of sales in 2004, compared with 11.5% of
sales in 2003, largely due to our retail office products business’s higher selling and distribution
expenses as a percentage of sales. Excluding the impact of our retail office products segment,
selling and distribution expenses declined as a percentage of sales by approximately 0.5% of sales
during 2004, compared with the previous fiscal year. The decrease was primarily attributable to
leveraging fixed costs on increased sales in Boise Building Solutions due to increased product
prices.
General and administrative expenses increased from 1.9% of sales to 2.3% of sales due to
higher payroll and benefit-related expenses.
In 2004, ‘‘Other (income) expense, net,’’ included a $46.5 million pretax gain on the sale of our
47% interest in Voyageur Panel to Ainsworth Lumber Co. Ltd., a $15.1 million pretax gain on the
sale of timberlands, mostly in Idaho, and a $59.9 million pretax gain on the sale of approximately
79,000 acres of timberland in western Louisiana, offset by approximately $18.9 million of costs
related to the Sale, $8.9 million of integration and facility closure costs and $7.1 million of costs
related to the sale of our Yakima, Washington, plywood and lumber facilities.
In 2003, ‘‘Other (income) expense, net’’ included a $10.1 million pretax charge for employee-
related costs. We recorded $9.2 million in the OfficeMax, Contract segment; $0.2 million in the
Boise Paper Solutions segment and $0.7 million in our Corporate and Other segment. Employee-
related costs are primarily for severance payments, most of which were paid in 2003, with the
remainder paid in 2004.
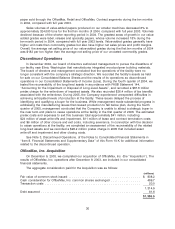
In 2004, we recorded a $280.6 million gain on the Sale. An additional $180 million of gain on
the Sale was deferred as a result of our continuing involvement with Boise Cascade, L.L.C. We will
recognize this gain as we reduce our investment in affiliates of Boise Cascade, L.L.C.
Equity in net income of affiliates was $6.3 million and $8.8 million in 2004 and 2003. The
variance was due to increased equity in earnings of Voyageur Panel, in which we had a 47%
interest. The increased equity in earnings of Voyageur Panel resulted from higher oriented strand
board (OSB) prices in 2004 than in 2003. In May 2004, we sold our equity interest to Ainsworth
Lumber Co. Ltd. for $91.2 million of cash.
Interest expense was $151.9 million and $132.5 million for 2004 and 2003. The increase was
due to incremental interest expense related to higher debt levels in 2004 as a result of the
additional borrowings for the OfficeMax, Inc. acquisition.
22