OfficeMax 2005 Annual Report Download - page 30
Download and view the complete annual report
Please find page 30 of the 2005 OfficeMax annual report below. You can navigate through the pages in the report by either clicking on the pages listed below, or by using the keyword search tool below to find specific information within the annual report.-
 1
1 -
2
-
3
-
4
-
5
-
6
-
7
-
8
-
9
-
10
-
11
-
12
-
13
-
14
-
15
-
16
-
17
-
18
-
19
-
 20
20 -
 21
21 -
 22
22 -
 23
23 -
 24
24 -
 25
25 -
 26
26 -
 27
27 -
 28
28 -
 29
29 -
 30
30 -
 31
31 -
 32
32 -
 33
33 -
 34
34 -
 35
35 -
 36
36 -
 37
37 -
 38
38 -
 39
39 -
 40
40 -
41
-
42
-
43
-
44
-
45
-
46
-
47
-
48
-
49
-
50
-
51
-
52
-
53
-
54
-
55
-
56
-
57
-
58
-
59
-
60
-
61
-
62
-
63
-
64
-
65
-
66
-
67
-
68
-
69
-
70
-
71
-
72
-
73
-
74
-
75
-
76
-
77
-
78
-
79
-
80
-
81
-
82
-
83
-
84
-
85
-
86
-
87
-
88
-
89
-
90
-
91
-
92
-
93
-
94
-
95
-
96
-
97
-
98
-
99
-
100
-
101
-
102
-
103
-
104
-
105
-
106
-
107
-
108
-
109
-
110
-
111
-
112
-
113
-
114
-
115
-
116
-
117
-
118
-
119
-
120
-
121
-
122
-
123
-
124
-
125
-
126
-
127
-
128
-
129
-
130
-
131
-
132
 |
 |

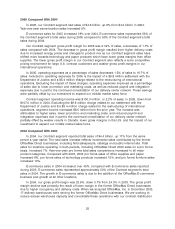
centers. For 2004, excluding OfficeMax Direct, contract gross profit margins were essentially flat
with 2003 despite the benefits of purchasing synergies obtained through the OfficeMax, Inc.
integration. Excluding 2004 purchasing synergies, contract margin rates declined in 2004 due to the
phasing in of new account growth and lags in passing through rising paper costs.
During 2004, operating expenses as a percentage of sales decreased 0.2% of sales to 21.2%,
including costs related to the integration and the 2003 cost reduction program. Excluding these
items, operating expenses as a percentage of sales decreased 0.1% of sales during 2004, despite
increased operating expenses associated with redundant former OfficeMax Direct warehouse
facilities. The decline in operating expenses as a percentage of sales was due to leveraging fixed
costs over higher sales, operating cost synergies obtained due to the OfficeMax, Inc. acquisition
and lower benefit expenses.
Our Contract segment reported $107.0 million of operating income in 2004, down 2.2% from
$109.4 million in 2003. Operating income in 2004 was lower due to the acquired former OfficeMax
Direct businesses, the decrease in gross profit margin and weaker than expected results in our
Canadian operations.
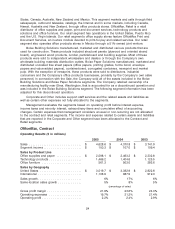
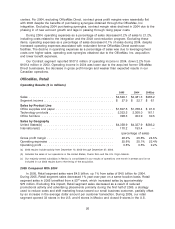
OfficeMax, Retail
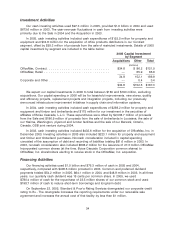
Operating Results ($ in millions)
2005 2004 2003(a)
Sales .............................................. $4,529.1 $4,481.3 $283.2
Segment income ...................................... $ 27.9 $ 22.7 $ 6.1
Sales by Product Line
Office supplies and paper ............................... $1,807.5 $1,768.4 $ 91.6
Technology products ................................... 2,323.3 2,308.0 161.1
Office furniture ....................................... 398.3 404.9 30.5
Sales by Geography
United States(b) ...................................... $4,358.9 $4,327.9 $283.2
International(c) ....................................... 170.2 153.4 —
(percentage of sales)
Gross profit margin .................................... 26.2% 25.6% 24.5%
Operating expenses ................................... 25.6% 25.1% 22.4%
Operating profit ....................................... 0.6% 0.5% 2.2%
(a) 2003 results include activity from December 10, 2003 through December 27, 2003.
(b) Includes the sales of our operations in the United States, Puerto Rico and the U.S. Virgin Islands.
(c) Our majority-owned subsidiary in Mexico is consolidated in our results of operations one month in arrears and is not
included in our 2003 results due to the timing of the acquisition.
2005 Compared With 2004
In 2005, Retail segment sales were $4.5 billion, up 1% from sales of $4.5 billion for 2004.
During 2005, Retail segment sales decreased 1% year-over-year on a same-location basis. Retail
segment sales in 2005 benefited from a 53rd week, which increased sales by approximately
$75 million. Excluding this impact, Retail segment sales decreased as a result of reduced
promotional activity and advertising placements primarily during the first half of 2005, a strategy
used to reduce costs and shift marketing focus toward our small business customer, partially offset
by an increase in the average dollar amount per customer transaction. During 2005, our retail
segment opened 33 stores in the U.S. and 6 stores in Mexico and closed 9 stores in the U.S.
26