OfficeMax 2005 Annual Report Download - page 37
Download and view the complete annual report
Please find page 37 of the 2005 OfficeMax annual report below. You can navigate through the pages in the report by either clicking on the pages listed below, or by using the keyword search tool below to find specific information within the annual report.-
 1
1 -
2
-
3
-
4
-
5
-
6
-
7
-
8
-
9
-
10
-
11
-
12
-
13
-
14
-
15
-
16
-
17
-
18
-
19
-
20
-
21
-
22
-
23
-
24
-
25
-
26
-
 27
27 -
 28
28 -
 29
29 -
 30
30 -
 31
31 -
 32
32 -
 33
33 -
 34
34 -
 35
35 -
 36
36 -
 37
37 -
 38
38 -
 39
39 -
 40
40 -
 41
41 -
 42
42 -
 43
43 -
 44
44 -
 45
45 -
 46
46 -
 47
47 -
48
-
49
-
50
-
51
-
52
-
53
-
54
-
55
-
56
-
57
-
58
-
59
-
60
-
61
-
62
-
63
-
64
-
65
-
66
-
67
-
68
-
69
-
70
-
71
-
72
-
73
-
74
-
75
-
76
-
77
-
78
-
79
-
80
-
81
-
82
-
83
-
84
-
85
-
86
-
87
-
88
-
89
-
90
-
91
-
92
-
93
-
94
-
95
-
96
-
97
-
98
-
99
-
100
-
101
-
102
-
103
-
104
-
105
-
106
-
107
-
108
-
109
-
110
-
111
-
112
-
113
-
114
-
115
-
116
-
117
-
118
-
119
-
120
-
121
-
122
-
123
-
124
-
125
-
126
-
127
-
128
-
129
-
130
-
131
-
132
 |
 |
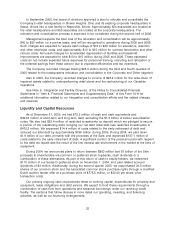
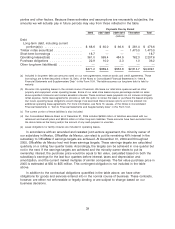
Operating Activities
Our operating activities used $57.7 million and $451.1 million of cash in 2005 and 2004,
respectively, and generated $324.7 million of cash in 2003. In 2005, items included in net income
(loss) provided $165.1 million of cash, and unfavorable changes in working capital items used
$222.8 million. Included in net working capital changes during 2005 are net income tax payments of
$134.1 million primarily related to gains recognized in 2004. Other working capital changes include
a reduction in accounts payable and accrued liabilities partially offset by improved accounts
receivable and inventory levels. In 2004, items included in net income provided $265.7 million of
cash and unfavorable changes in working capital items used $716.8 million of cash from
operations. In 2003, items included in net income provided $407.9 million of cash, and unfavorable
changes in working capital items used $83.2 million of cash from operations.
We have sold fractional ownership interests in a defined pool of trade accounts receivable. At
December 31, 2005 and 2004, $163.0 million and $120.0 million, respectively, of sold accounts
receivable were excluded from ‘‘Receivables’’ in our Consolidated Balance Sheet, compared with
$250 million excluded at December 31, 2003. The increase at December 31, 2005, in sold accounts
receivable of $43.0 million from the amount at December 31, 2004, provided cash from operations
in 2005. During the third quarter of 2004, in anticipation of the Sale, we stopped selling the
receivables related to the Boise Building Solutions and Boise Paper Solutions segments, reducing
the receivables sold as a part of this program at the end of the year. The decrease at December 31,
2004, in sold accounts receivable of $130.0 million from the amount at December 31, 2003, used
cash from operations in 2004.
During the period of January 1 through October 28, 2004, some of our employees were
covered by noncontributory defined benefit pension plans. Effective July 31, 2004, we spun off the
portion of each plan attributable to active employees in the forest products businesses. Effective
October 29, 2004, under the terms of the asset purchase agreement with affiliates of Boise
Cascade, L.L.C., we transferred sponsorship of the spun-off plans to Boise Cascade, L.L.C., and
only those terminated, vested employees and retirees whose employment with us ended on or
before July 31, 2004, and some active OfficeMax, Contract employees were covered under the
plans remaining with us. The assets of the pension plans are invested primarily in common stocks,
fixed-income securities and cash equivalents. The market performance of these investments affects
our recorded pension obligations, expense and cash contributions. Pension expense in 2005 was
$21.7 million. Pension expense for the year ended December 31, 2004, was $169.7 million,
including $94.9 million of curtailment expense related to the Sale, compared with $77.1 million in
2003. These are noncash charges in our consolidated financial statements. In 2005, we made
contributions to our pension plans totaling $2.8 million. In 2004, we made cash contributions to our
pension plans totaling $279.8 million, compared with $84.5 million in 2003. The asset purchase
agreement with affiliates of Boise Cascade, L.L.C., required us to fully fund the spun-off plans on an
accumulated-benefit-obligation basis using a 6.25% liability discount rate. Since our active
employees who are covered by the retained plans, as well as all of the inactive participants, are no
longer accruing additional benefits, we expect our future contributions to these plans to be greatly
reduced. There are no minimum required contributions in 2006. However, we may elect to make
voluntary contributions. See ‘‘Critical Accounting Estimates’’ in this Management’s Discussion and
Analysis of Financial Condition and Results of Operations for more information.
Our ratio of current assets to current liabilities was 1.22:1 at December 31, 2005, compared
with 1.75:1 at December 31, 2004. The decrease in our ratio of current assets to current liabilities at
December 31, 2005, resulted primarily from the decrease in cash and cash equivalents in 2005,
compared with 2004 resulting from our share repurchases and debt repayments.
33