OfficeMax 2005 Annual Report Download - page 33
Download and view the complete annual report
Please find page 33 of the 2005 OfficeMax annual report below. You can navigate through the pages in the report by either clicking on the pages listed below, or by using the keyword search tool below to find specific information within the annual report.-
 1
1 -
2
-
3
-
4
-
5
-
6
-
7
-
8
-
9
-
10
-
11
-
12
-
13
-
14
-
15
-
16
-
17
-
18
-
19
-
20
-
21
-
22
-
 23
23 -
 24
24 -
 25
25 -
 26
26 -
 27
27 -
 28
28 -
 29
29 -
 30
30 -
 31
31 -
 32
32 -
 33
33 -
 34
34 -
 35
35 -
 36
36 -
 37
37 -
 38
38 -
 39
39 -
 40
40 -
 41
41 -
 42
42 -
 43
43 -
44
-
45
-
46
-
47
-
48
-
49
-
50
-
51
-
52
-
53
-
54
-
55
-
56
-
57
-
58
-
59
-
60
-
61
-
62
-
63
-
64
-
65
-
66
-
67
-
68
-
69
-
70
-
71
-
72
-
73
-
74
-
75
-
76
-
77
-
78
-
79
-
80
-
81
-
82
-
83
-
84
-
85
-
86
-
87
-
88
-
89
-
90
-
91
-
92
-
93
-
94
-
95
-
96
-
97
-
98
-
99
-
100
-
101
-
102
-
103
-
104
-
105
-
106
-
107
-
108
-
109
-
110
-
111
-
112
-
113
-
114
-
115
-
116
-
117
-
118
-
119
-
120
-
121
-
122
-
123
-
124
-
125
-
126
-
127
-
128
-
129
-
130
-
131
-
132
 |
 |

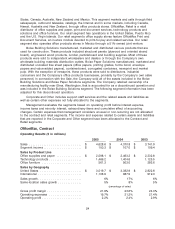
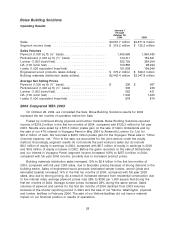
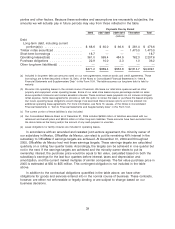
Boise Paper Solutions
Operating Results
January 1
through
October 28,
2004 2003
Sales .......................................... $1,670.4 million $1,852.6 million
Segment income (loss) ............................. $ 38.8 million $ (13.9) million
(short tons)
Sales Volumes
Uncoated free sheet ................................ 1,249,000 1,396,000
Containerboard ................................... 537,000 650,000
Newsprint ....................................... 349,000 416,000
Other .......................................... 138,000 146,000
2,273,000 2,608,000
(per short ton)
Average Net Selling Prices
Uncoated free sheet ................................ $ 718 $ 721
Containerboard ................................... 365 337
Newsprint ....................................... 434 397
2004 Compared With 2003
On October 29, 2004, we completed the Sale. Boise Paper Solutions results for 2004 represent
the ten months of operation before the Sale.
Boise Paper Solutions reported income of $38.8 million for the first ten months of 2004,
compared with a loss of $13.9 million for full year 2003. Results in 2004 were aided by a pretax
gain of $59.9 million on the sale in March of approximately 79,000 acres of timberland in western
Louisiana for $84 million. We recorded the $59.9 million pretax gain in ‘‘Other (income) expense,
net.’’ Excluding this gain, the segment lost $21.1 million in the first ten months of 2004. Results in
2004, excluding the gain, compare unfavorably with 2003 results because of less sales volume as a
result of the shorter reporting period in 2004, $2.8 million of costs and/or lost income due to timber
and mill damage and lost production at our Alabama paper mill related to disruption from
hurricanes in September, increased unit manufacturing costs and operating difficulties due to
adverse weather conditions and other production issues in the first quarter of 2004. Unit
manufacturing costs increased 3% during the ten-month period in 2004, compared with full year
2003, primarily due to increased fiber costs.
Although markets strengthened in 2004, sales for the first ten months of the year were
$1.7 billion, compared with $1.9 billion for full year 2003. Total sales volume for the first ten months
of 2004 was 13% less than sales volume for full year 2003. Sales and sales volumes declined
because of the shorter reporting period in 2004. Weighted average paper prices increased 3%.
Average newsprint and containerboard prices increased $37 per ton and $28 per ton, respectively,
compared with prices in 2003, while the average price for uncoated free sheet, our largest paper
grade, was $3 less per ton than in 2003. We took 57,000 tons of market-related downtime during
the first ten months of 2004, compared with 197,000 tons during full year 2003. The decrease in
curtailment in 2004 reflects growing market demand and a 2% increase in the amount of office
29