OfficeMax 2005 Annual Report Download - page 25
Download and view the complete annual report
Please find page 25 of the 2005 OfficeMax annual report below. You can navigate through the pages in the report by either clicking on the pages listed below, or by using the keyword search tool below to find specific information within the annual report.-
 1
1 -
2
-
3
-
4
-
5
-
6
-
7
-
8
-
9
-
10
-
11
-
12
-
13
-
14
-
 15
15 -
 16
16 -
 17
17 -
 18
18 -
 19
19 -
 20
20 -
 21
21 -
 22
22 -
 23
23 -
 24
24 -
 25
25 -
 26
26 -
 27
27 -
 28
28 -
 29
29 -
 30
30 -
 31
31 -
 32
32 -
 33
33 -
 34
34 -
 35
35 -
36
-
37
-
38
-
39
-
40
-
41
-
42
-
43
-
44
-
45
-
46
-
47
-
48
-
49
-
50
-
51
-
52
-
53
-
54
-
55
-
56
-
57
-
58
-
59
-
60
-
61
-
62
-
63
-
64
-
65
-
66
-
67
-
68
-
69
-
70
-
71
-
72
-
73
-
74
-
75
-
76
-
77
-
78
-
79
-
80
-
81
-
82
-
83
-
84
-
85
-
86
-
87
-
88
-
89
-
90
-
91
-
92
-
93
-
94
-
95
-
96
-
97
-
98
-
99
-
100
-
101
-
102
-
103
-
104
-
105
-
106
-
107
-
108
-
109
-
110
-
111
-
112
-
113
-
114
-
115
-
116
-
117
-
118
-
119
-
120
-
121
-
122
-
123
-
124
-
125
-
126
-
127
-
128
-
129
-
130
-
131
-
132
 |
 |
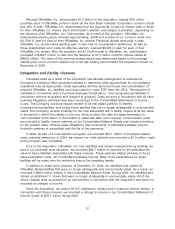
In 2004, ‘‘Other (income) expense, net’’ was $83.8 million of income and included the
$46.5 million pretax gain on the sale of Voyageur Panel, a $59.9 million pretax gain on the sale of
approximately 79,000 acres of timberland in western Louisiana and a $15.1 million pretax gain on
sale of timberlands, mostly in Idaho, offset by approximately $18.9 million of costs related to the
Sale, $8.9 million of integration and facility closure costs, and $7.1 million of costs related to the
sale of our Yakima, Washington plywood and lumber facilities (see Note 7, Other (Income) Expense,
Net, of the Notes to Consolidated Financial Statements in ‘‘Item 8. Financial Statements and
Supplementary Data’’ of this Form 10-K for additional information related to the components of
Other (Income) Expense, net).
In 2004, we recorded a $280.6 million gain on the Sale. An additional $180 million gain on the
Sale was deferred as a result of our continuing involvement with Boise Cascade L.L.C. We will
recognize this gain as we reduce our investment in affiliates of Boise Cascade L.L.C.
In 2005, equity in net income of affiliates was $5.5 million compared with $6.3 million in 2004.
The year-over-year variance was due to equity in earnings of Voyageur Panel, which was included
in the results for the first half of 2004. We sold our 47% interest in Voyageur Panel to Ainsworth
Lumber Co. Ltd., for $91.2 million in cash in May 2004.
During 2005 and 2004, we incurred costs related to the early buyback of debt of approximately
$14.4 million and $137.1 million, respectively.
Interest expense was $128.5 million and $151.9 million for the years ended December 31, 2005
and 2004, respectively. The decrease in interest expense was due to reduced debt levels in 2005, a
result of debt repurchases and retirements funded with proceeds from the Sale. In 2005, interest
expense included approximately $81.5 million of interest recognized as a result of consolidating the
issuers of $1.5 billion of timber securitization notes in the Company’s financial statements. The
interest expense associated with the timber securitization notes is offset by interest income of
$82.3 million earned on the timber notes receivable. The interest income on the timber notes
receivable is included in interest income and is not netted against the related interest expense in
our Consolidated Statement of Income (Loss).
Interest income was $97.3 million in 2005 compared with $14.1 million in 2004. Interest income
includes interest earned on the timber notes receivable. The increase in interest income is primarily
due to the inclusion of a full year of interest earned on the timber notes receivable in 2005
compared to only two months in 2004, with the remainder due to the increase in cash and
short-term investments following the Sale.
We recognized a tax provision of $1.2 million on our loss from continuing operations of
$37.6 million in 2005, or an effective rate of (3.3)%, compared with an effective tax rate applicable
to continuing operations of 37.5% for 2004. Changes in estimated tax rates are due to the sensitivity
of the rates to changing income levels and the mix of domestic and foreign sources of income as
well as the increase in the valuation allowance for certain state net operating losses and the
non-deductible nature of certain severance costs and the legal settlement recorded during 2005.
Minority interest expense, net of income tax was $2.4 million in 2005 compared to $3.0 million
in 2004.
Loss from continuing operations for 2005 was $41.2 million or $0.58 per diluted share,
compared with income from continuing operations of $234.1 million, or $2.44 per diluted share in
2004. Including the loss from discontinued operations, the net loss for 2005 was $73.8 million, or
$0.99 per diluted share, compared with net income of $173.1 million, or $1.77 per diluted share in
2004. In 2005, net loss included a $28.2 million pretax charge for the write-down of impaired assets
at our Elma, Washington manufacturing facility, which is accounted for as a discontinued operation.
21