OfficeMax 2005 Annual Report Download - page 31
Download and view the complete annual report
Please find page 31 of the 2005 OfficeMax annual report below. You can navigate through the pages in the report by either clicking on the pages listed below, or by using the keyword search tool below to find specific information within the annual report.-
 1
1 -
2
-
3
-
4
-
5
-
6
-
7
-
8
-
9
-
10
-
11
-
12
-
13
-
14
-
15
-
16
-
17
-
18
-
19
-
20
-
 21
21 -
 22
22 -
 23
23 -
 24
24 -
 25
25 -
 26
26 -
 27
27 -
 28
28 -
 29
29 -
 30
30 -
 31
31 -
 32
32 -
 33
33 -
 34
34 -
 35
35 -
 36
36 -
 37
37 -
 38
38 -
 39
39 -
 40
40 -
 41
41 -
42
-
43
-
44
-
45
-
46
-
47
-
48
-
49
-
50
-
51
-
52
-
53
-
54
-
55
-
56
-
57
-
58
-
59
-
60
-
61
-
62
-
63
-
64
-
65
-
66
-
67
-
68
-
69
-
70
-
71
-
72
-
73
-
74
-
75
-
76
-
77
-
78
-
79
-
80
-
81
-
82
-
83
-
84
-
85
-
86
-
87
-
88
-
89
-
90
-
91
-
92
-
93
-
94
-
95
-
96
-
97
-
98
-
99
-
100
-
101
-
102
-
103
-
104
-
105
-
106
-
107
-
108
-
109
-
110
-
111
-
112
-
113
-
114
-
115
-
116
-
117
-
118
-
119
-
120
-
121
-
122
-
123
-
124
-
125
-
126
-
127
-
128
-
129
-
130
-
131
-
132
 |
 |
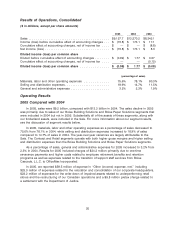
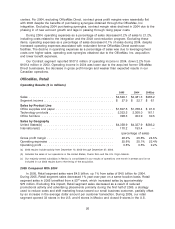
Our Retail segment gross profit margin for 2005 was 26.2% of sales, compared to 25.6% of
sales in 2004. The increase in gross profit margin was primarily due to a shift in mix to higher
margin products and services, a direct result of our new promotional and advertising strategy.
Retail segment operating expenses were 25.6% of sales in 2005 compared to 25.1% in 2004. In
2005, we recorded $17.9 million in asset impairment charges primarily related to the retail store
closures. Excluding these charges, operating expenses were 25.2% of sales in 2005.
For 2005, the Retail segment had operating income of $27.9 million, compared to $22.7 million
in 2004. Operating margin for our Retail segment was 0.6% of sales in 2005, compared with 0.5%
of sales in 2004. In 2005, we recorded $17.9 million in asset impairment charges primarily related to
the retail store closures. Excluding these charges, operating margin in 2005 was 1.0% of sales. This
increase in operating margin is a result of increased sales due to the additional selling week and
improved gross profit margin due to a shift in mix to higher margin products and services.
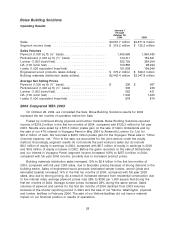
2004 Compared With 2003
Sales for our Retail segment were $4.5 billion, down 0.9% from pro forma sales in 2003. The
sales decrease primarily resulted from closing 47 U.S. superstores during 2004, most of which
closed in the first quarter. Same-location sales increased 1.3% in 2004, compared with pro forma
2003 sales. The comparable-location sales increase was driven primarily by higher average dollar
amount per customer transaction, which increased 2.6% year over year. During 2004, our Retail
segment opened 8 stores in the U.S. and 5 stores in Mexico.
Gross profit margin for the Retail segment was 25.6% in 2004, compared with 24.5% in 2003.
The gross profit margin in 2003 represents activity for the 17 selling days following the
OfficeMax, Inc. acquisition on December 9, 2003, which includes a seasonal shift in sales mix
toward lower-margin technology merchandise. Gross profit margins also increased year over year
as a result of purchasing and other synergies.
Operating expenses were 25.1% of sales in 2004, up 2.7% of sales from 2003, primarily as a
result of the increased leverage from the high-volume holiday sales in 2003.
Our Retail segment reported operating income of $22.7 million, or 0.5% of sales, in 2004. The
low level of profitability in 2004 was due to weaker-than-expected sales, especially during the
important back-to-school and holiday periods, which led to reduced margin dollars, lower vendor
income, and a higher expense ratio as a percentage of sales. OfficeMax, Retail’s profitability was
also negatively impacted by greater promotional sales at low or no profitability.
Corporate and Other
In 2005, net Corporate and Other expenses were $120.2 million compared to income of
$185.7 million in 2004, which included a $280.6 million gain from the Sale. Excluding the gain on
the Sale, net Corporate and Other expenses increased $25.3 million in 2005 compared to 2004
primarily as a result of incremental expenses related to the relocation and consolidation of our
corporate headquarters and the write-off of impaired assets, as well as costs for one-time severance
payments and other costs which are not expected to be ongoing expenses. In 2005, such items
amounted to a net expense of $58.5 million. In 2003, total Corporate and Other expenses were
$46.4 million.
27