Kroger 2015 Annual Report Download - page 99
Download and view the complete annual report
Please find page 99 of the 2015 Kroger annual report below. You can navigate through the pages in the report by either clicking on the pages listed below, or by using the keyword search tool below to find specific information within the annual report.-
 1
1 -
2
-
3
-
4
-
5
-
6
-
7
-
8
-
9
-
10
-
11
-
12
-
13
-
14
-
15
-
16
-
17
-
18
-
19
-
20
-
21
-
22
-
23
-
24
-
25
-
26
-
27
-
28
-
29
-
30
-
31
-
32
-
33
-
34
-
35
-
36
-
37
-
38
-
39
-
40
-
41
-
42
-
43
-
44
-
45
-
46
-
47
-
48
-
49
-
50
-
51
-
52
-
53
-
54
-
55
-
56
-
57
-
58
-
59
-
60
-
61
-
62
-
63
-
64
-
65
-
66
-
67
-
68
-
69
-
70
-
71
-
72
-
73
-
74
-
75
-
76
-
77
-
78
-
79
-
80
-
81
-
82
-
83
-
84
-
85
-
86
-
87
-
88
-
 89
89 -
 90
90 -
 91
91 -
 92
92 -
 93
93 -
 94
94 -
 95
95 -
 96
96 -
 97
97 -
 98
98 -
 99
99 -
 100
100 -
 101
101 -
 102
102 -
 103
103 -
 104
104 -
 105
105 -
 106
106 -
 107
107 -
 108
108 -
 109
109 -
110
-
111
-
112
-
113
-
114
-
115
-
116
-
117
-
118
-
119
-
120
-
121
-
122
-
123
-
124
-
125
-
126
-
127
-
128
-
129
-
130
-
131
-
132
-
133
-
134
-
135
-
136
-
137
-
138
-
139
-
140
-
141
-
142
-
143
-
144
-
145
-
146
-
147
-
148
-
149
-
150
-
151
-
152
-
153
 |
 |
A-25
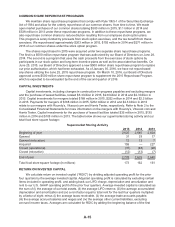
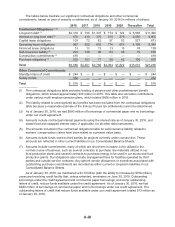
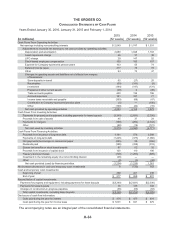
Total debt, including both the current and long-term portions of capital lease and lease-financing
obligations increased $346 million to $11.7 billion as of year-end 2014, compared to 2013. The increase
in 2014, compared to 2013, resulted primarily from (i) the issuance of $500 million of senior notes bearing
an interest rate of 2.95% and (ii) an increase in commercial paper of $25 million, partially offset by
payments at maturity of $300 million of senior notes bearing an interest rate of 4.95%. The increase in
financing obligations was due to partially funding our outstanding common share repurchases.
Liquidity Needs
We estimate our liquidity needs over the next twelve-month period to range from $6.6 to $6.9 billion,
which includes anticipated requirements for working capital, capital investments, interest payments
and scheduled principal payments of debt and commercial paper, offset by cash and temporary cash
investments on hand at the end of 2015. We generally operate with a working capital deficit due to
our efficient use of cash in funding operations and because we have consistent access to the capital
markets. Based on current operating trends, we believe that cash flows from operating activities and
other sources of liquidity, including borrowings under our commercial paper program and bank credit
facility, will be adequate to meet our liquidity needs for the next twelve months and for the foreseeable
future beyond the next twelve months. We have approximately $990 million of commercial paper and $1.3
billion of senior notes maturing in the next twelve months, which is included in the range of $6.6 to $6.9
billion in estimated liquidity needs. We expect to refinance this debt, in 2016, by issuing additional senior
notes or commercial paper on favorable terms based on our past experience. We also currently plan to
continue repurchases of common shares under the Company’s share repurchase programs. We believe
we have adequate coverage of our debt covenants to continue to maintain our current debt ratings and to
respond effectively to competitive conditions.
Factors Affecting Liquidity
We can currently borrow on a daily basis approximately $2.75 billion under our commercial paper
(“CP”) program. At January 30, 2016, we had $990 million of CP borrowings outstanding. CP borrowings
are backed by our credit facility, and reduce the amount we can borrow under the credit facility. If our
short-term credit ratings fall, the ability to borrow under our current CP program could be adversely
affected for a period of time and increase our interest cost on daily borrowings under our CP program.
This could require us to borrow additional funds under the credit facility, under which we believe we have
sufficient capacity. However, in the event of a ratings decline, we do not anticipate that our borrowing
capacity under our CP program would be any lower than $500 million on a daily basis. Although our
ability to borrow under the credit facility is not affected by our credit rating, the interest cost on borrowings
under the credit facility could be affected by an increase in our Leverage Ratio. As of March 23, 2016, we
had $1.1 billion of CP borrowings outstanding. The increase as of March 23, 2016, compared to year-end
2015, was due to partially funding our outstanding common share repurchases.
Our credit facility requires the maintenance of a Leverage Ratio and a Fixed Charge Coverage Ratio
(our “financial covenants”). A failure to maintain our financial covenants would impair our ability to borrow
under the credit facility. These financial covenants and ratios are described below:
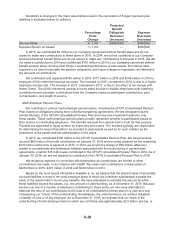
• Our Leverage Ratio (the ratio of Net Debt to Consolidated EBITDA, as defined in the credit facility)
was 1.97 to 1 as of January 30, 2016. If this ratio were to exceed 3.50 to 1, we would be in default
of our credit facility and our ability to borrow under the facility would be impaired. In addition, our
Applicable Margin on borrowings is determined by our Leverage Ratio.
• Our Fixed Charge Coverage Ratio (the ratio of Consolidated EBITDA plus Consolidated Rental
Expense to Consolidated Cash Interest Expense plus Consolidated Rental Expense, as defined in
the credit facility) was 5.30 to 1 as of January 30, 2016. If this ratio fell below 1.70 to 1, we would be
in default of our credit facility and our ability to borrow under the facility would be impaired.
Our credit agreement is more fully described in Note 6 to the Consolidated Financial Statements.
We were in compliance with our financial covenants at year-end 2015.