Kroger 2015 Annual Report Download - page 35
Download and view the complete annual report
Please find page 35 of the 2015 Kroger annual report below. You can navigate through the pages in the report by either clicking on the pages listed below, or by using the keyword search tool below to find specific information within the annual report.-
 1
1 -
2
-
3
-
4
-
5
-
6
-
7
-
8
-
9
-
10
-
11
-
12
-
13
-
14
-
15
-
16
-
17
-
18
-
19
-
20
-
21
-
22
-
23
-
24
-
 25
25 -
 26
26 -
 27
27 -
 28
28 -
 29
29 -
 30
30 -
 31
31 -
 32
32 -
 33
33 -
 34
34 -
 35
35 -
 36
36 -
 37
37 -
 38
38 -
 39
39 -
 40
40 -
 41
41 -
 42
42 -
 43
43 -
 44
44 -
 45
45 -
46
-
47
-
48
-
49
-
50
-
51
-
52
-
53
-
54
-
55
-
56
-
57
-
58
-
59
-
60
-
61
-
62
-
63
-
64
-
65
-
66
-
67
-
68
-
69
-
70
-
71
-
72
-
73
-
74
-
75
-
76
-
77
-
78
-
79
-
80
-
81
-
82
-
83
-
84
-
85
-
86
-
87
-
88
-
89
-
90
-
91
-
92
-
93
-
94
-
95
-
96
-
97
-
98
-
99
-
100
-
101
-
102
-
103
-
104
-
105
-
106
-
107
-
108
-
109
-
110
-
111
-
112
-
113
-
114
-
115
-
116
-
117
-
118
-
119
-
120
-
121
-
122
-
123
-
124
-
125
-
126
-
127
-
128
-
129
-
130
-
131
-
132
-
133
-
134
-
135
-
136
-
137
-
138
-
139
-
140
-
141
-
142
-
143
-
144
-
145
-
146
-
147
-
148
-
149
-
150
-
151
-
152
-
153
 |
 |

33
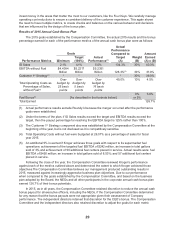
(2) Return on invested capital is calculated by dividing adjusted operating profit for the prior four
quarters by the average invested capital. Adjusted operating profit is calculated by excluding certain
items included in operating profit, and adding our LIFO charge, depreciation and amortization, and
rent. Average invested capital will be calculated as the sum of (i) the average of our total assets,
(ii) the average LIFO reserve, (iii) the average accumulated depreciation and amortization, and
(iv) a rent factor equal to total rent for the last four quarters multiplied by a factor of eight; minus
(i) the average taxes receivable, (ii) the average trade accounts payable, (iii) the average accrued
salaries and wages, and (iv) the average other current liabilities, excluding accrued income taxes.
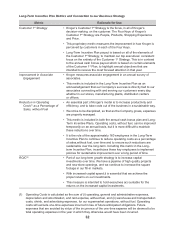
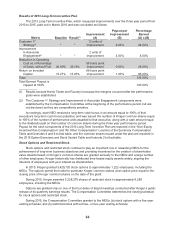
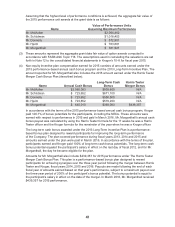
The following table summarizes the Long-Term Incentive Plans adopted for the years shown:
2013 Plan 2014 Plan 2015 Plan
Performance Period 2013 to 2015 2014 to 2016 2015 to 2017
Payout Date March 2016 March 2017 March 2018
Long-term Cash
Bonus Potential
Salary at end of
fiscal year 2012*
Salary at end of
fiscal year 2013*
Salary at end of
fiscal year 2014*
Performance Metrics
Customer 1st Strategy 2% payout per unit
improvement
2% payout per unit
improvement
4% payout per unit
improvement
Improvement in Associate
Engagement
4% payout per unit
improvement
4% payout per unit
improvement
4% payout per unit
improvement
Reduction in Operating Cost as a
Percentage of Sales,
without Fuel
0.50% payout per
0.01% reduction
in operating costs
Baseline: 26.69%
0.50% payout per
0.01% reduction
in operating costs
Baseline: 26.68%
0.50% payout per
0.01% reduction
in operating costs
Baseline: 26.41%
ROIC 1% payout per
0.01% improvement
in ROIC
Baseline: 13.27%
1% payout per
0.01% improvement
in ROIC
Baseline: 13.29%
1% payout per
0.01% improvement
in ROIC
Baseline: 13.76%
* Or date of plan entry, if later.
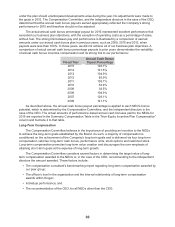
The Compensation Committee has made adjustments to the percentage payouts for the
components of the Long-Term Incentive Plans over time to account for the increasing difficulty of
achieving compounded improvement.
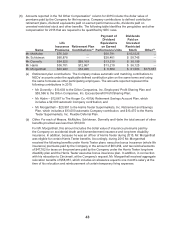
During 2015, Kroger awarded 503,276 performance units to approximately 160 employees,
including the NEOs.