Kroger 2015 Annual Report Download - page 130
Download and view the complete annual report
Please find page 130 of the 2015 Kroger annual report below. You can navigate through the pages in the report by either clicking on the pages listed below, or by using the keyword search tool below to find specific information within the annual report.-
 1
1 -
2
-
3
-
4
-
5
-
6
-
7
-
8
-
9
-
10
-
11
-
12
-
13
-
14
-
15
-
16
-
17
-
18
-
19
-
20
-
21
-
22
-
23
-
24
-
25
-
26
-
27
-
28
-
29
-
30
-
31
-
32
-
33
-
34
-
35
-
36
-
37
-
38
-
39
-
40
-
41
-
42
-
43
-
44
-
45
-
46
-
47
-
48
-
49
-
50
-
51
-
52
-
53
-
54
-
55
-
56
-
57
-
58
-
59
-
60
-
61
-
62
-
63
-
64
-
65
-
66
-
67
-
68
-
69
-
70
-
71
-
72
-
73
-
74
-
75
-
76
-
77
-
78
-
79
-
80
-
81
-
82
-
83
-
84
-
85
-
86
-
87
-
88
-
89
-
90
-
91
-
92
-
93
-
94
-
95
-
96
-
97
-
98
-
99
-
100
-
101
-
102
-
103
-
104
-
105
-
106
-
107
-
108
-
109
-
110
-
111
-
112
-
113
-
114
-
115
-
116
-
117
-
118
-
119
-
 120
120 -
 121
121 -
 122
122 -
 123
123 -
 124
124 -
 125
125 -
 126
126 -
 127
127 -
 128
128 -
 129
129 -
 130
130 -
 131
131 -
 132
132 -
 133
133 -
 134
134 -
 135
135 -
 136
136 -
 137
137 -
 138
138 -
 139
139 -
 140
140 -
141
-
142
-
143
-
144
-
145
-
146
-
147
-
148
-
149
-
150
-
151
-
152
-
153
 |
 |
A-56
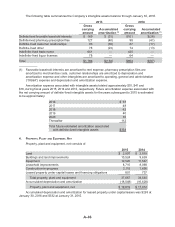
Mergers are accounted for using the acquisition method of accounting, which requires that the
purchase price paid for an acquisition be allocated to the assets and liabilities acquired based on their
estimated fair values as of the effective date of the acquisition, with the excess of the purchase price over
the net assets being recorded as goodwill. See Note 2 for further discussion related to accounting for
mergers.
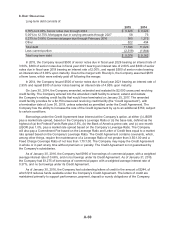
FAIR VALUE OF OTHER FINANCIAL INSTRUMENTS
Current and Long-term Debt
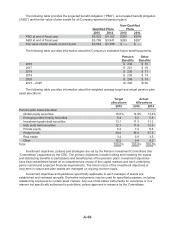
The fair value of the Company’s long-term debt, including current maturities, was estimated based on
the quoted market prices for the same or similar issues adjusted for illiquidity based on available market
evidence. If quoted market prices were not available, the fair value was based upon the net present value
of the future cash flow using the forward interest rate yield curve in effect at respective year-ends. At
January 30, 2016, the fair value of total debt was $12,344 compared to a carrying value of $11,396. At
January 31, 2015, the fair value of total debt was $12,378 compared to a carrying value of $11,026.
Cash and Temporary Cash Investments, Store Deposits In-Transit, Receivables, Prepaid and Other
Current Assets, Trade Accounts Payable, Accrued Salaries and Wages and Other Current Liabilities
The carrying amounts of these items approximated fair value.
Other Assets
The fair values of these investments were estimated based on quoted market prices for those or
similar investments, or estimated cash flows, if appropriate. At January 30, 2016 and January 31, 2015,
the carrying and fair value of long-term investments for which fair value is determinable was $128 and
$133, respectively. At January 30, 2016 and January 31, 2015, the carrying value of notes receivable for
which fair value is determinable was $145 and $98, respectively.
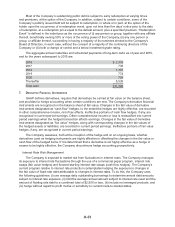
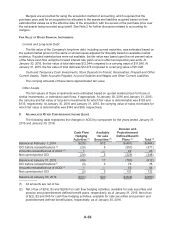
9. ACCUMULATED OTHER COMPREHENSIVE INCOME (LOSS)
The following table represents the changes in AOCI by component for the years ended January 31,
2015 and January 30, 2016:
Cash Flow
Hedging
Activities (1)
Available
for sale
Securities (1)
Pension and
Postretirement
Defined Benefit
Plans (1) Total (1)
Balance at February 1, 2014 $(25) $12 $(451) $(464)
OCI before reclassifications (2) (25) 5 (351) (371)
Amounts reclassified out of AOCI (3) 1 — 22 23
Net current-period OCI (24) 5 (329) (348)
Balance at January 31, 2015 (49) 17 (780) (812)
OCI before reclassifications (2) (3) 3 78 78
Amounts reclassified out of AOCI (3) 1 — 53 54
Net current-period OCI (2) 3 131 132
Balance at January 30, 2016 $(51) $20 $(649) $(680)
(1) All amounts are net of tax.
(2) Net of tax of $(14), $3 and $(206) for cash flow hedging activities, available for sale securities and
pension and postretirement defined benefit plans, respectively, as of January 31, 2015. Net of tax
of $(2), $2 and $45 for cash flow hedging activities, available for sale securities and pension and
postretirement defined benefit plans, respectively, as of January 30, 2016.