Kroger 2015 Annual Report Download - page 76
Download and view the complete annual report
Please find page 76 of the 2015 Kroger annual report below. You can navigate through the pages in the report by either clicking on the pages listed below, or by using the keyword search tool below to find specific information within the annual report.-
 1
1 -
2
-
3
-
4
-
5
-
6
-
7
-
8
-
9
-
10
-
11
-
12
-
13
-
14
-
15
-
16
-
17
-
18
-
19
-
20
-
21
-
22
-
23
-
24
-
25
-
26
-
27
-
28
-
29
-
30
-
31
-
32
-
33
-
34
-
35
-
36
-
37
-
38
-
39
-
40
-
41
-
42
-
43
-
44
-
45
-
46
-
47
-
48
-
49
-
50
-
51
-
52
-
53
-
54
-
55
-
56
-
57
-
58
-
59
-
60
-
61
-
62
-
63
-
64
-
65
-
 66
66 -
 67
67 -
 68
68 -
 69
69 -
 70
70 -
 71
71 -
 72
72 -
 73
73 -
 74
74 -
 75
75 -
 76
76 -
 77
77 -
 78
78 -
 79
79 -
 80
80 -
 81
81 -
 82
82 -
 83
83 -
 84
84 -
 85
85 -
 86
86 -
87
-
88
-
89
-
90
-
91
-
92
-
93
-
94
-
95
-
96
-
97
-
98
-
99
-
100
-
101
-
102
-
103
-
104
-
105
-
106
-
107
-
108
-
109
-
110
-
111
-
112
-
113
-
114
-
115
-
116
-
117
-
118
-
119
-
120
-
121
-
122
-
123
-
124
-
125
-
126
-
127
-
128
-
129
-
130
-
131
-
132
-
133
-
134
-
135
-
136
-
137
-
138
-
139
-
140
-
141
-
142
-
143
-
144
-
145
-
146
-
147
-
148
-
149
-
150
-
151
-
152
-
153
 |
 |

A-2
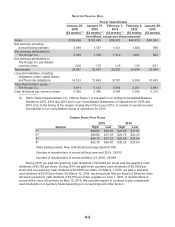
SELECTED FINANCIAL DATA
Fiscal Years Ended
January 30,
2016
(52 weeks) (1)
January 31,
2015
(52 weeks) (1)
February 1,
2014
(52 weeks) (1)
February 2,
2013
(53 weeks)
January 28,
2012
(52 weeks)
(In millions, except per share amounts)
Sales $109,830 $108,465 $98,375 $96,619 $90,269
Net earnings including
noncontrolling interests 2,049 1,747 1,531 1,508 596
Net earnings attributable to
The Kroger Co. 2,039 1,728 1,519 1,497 602
Net earnings attributable to
The Kroger Co. per diluted
common share 2.06 1.72 1.45 1.39 0.51
Total assets 33,897 30,497 29,281 24,634 23,454
Long-term liabilities, including
obligations under capital leases
and financing obligations 14,123 13,663 13,181 9,359 10,405
Total shareholders’ equity –
The Kroger Co. 6,811 5,412 5,384 4,207 3,981
Cash dividends per common share 0.395 0.340 0.308 0.248 0.215
(1) Harris Teeter Supermarkets, Inc. (“Harris Teeter”) is included in our ending Consolidated Balance
Sheets for 2015, 2014 and 2013 and in our Consolidated Statements of Operations for 2015 and
2014. Due to the timing of the merger closing late in fiscal year 2013, its results of operations were
not material to our consolidated results of operations for 2013.
COMMON SHARE PRICE RANGE
2015 2014
Quarter High Low High Low
1st $38.87 $34.05 $23.95 $17.57
2nd $38.65 $37.09 $25.75 $23.25
3rd $38.73 $27.32 $29.08 $24.99
4th $42.75 $36.00 $35.03 $28.64
Main trading market: New York Stock Exchange (Symbol KR)
Number of shareholders of record at fiscal year-end 2015: 29,102
Number of shareholders of record at March 23, 2016: 28,959
During 2015, we paid two quarterly cash dividends of $0.0925 per share and two quarterly cash
dividends of $0.105 per share. During 2014, we paid three quarterly cash dividends of $0.0825 per
share and one quarterly cash dividend of $0.0925 per share. On March 1, 2016, we paid a quarterly
cash dividend of $0.105 per share. On March 10, 2016, we announced that our Board of Directors have
declared a quarterly cash dividend of $0.105 per share, payable on June 1, 2016, to shareholders of
record at the close of business on May 13, 2016. We currently expect to continue to pay comparable
cash dividends on a quarterly basis depending on our earnings and other factors.