Kroger 2015 Annual Report Download - page 89
Download and view the complete annual report
Please find page 89 of the 2015 Kroger annual report below. You can navigate through the pages in the report by either clicking on the pages listed below, or by using the keyword search tool below to find specific information within the annual report.-
 1
1 -
2
-
3
-
4
-
5
-
6
-
7
-
8
-
9
-
10
-
11
-
12
-
13
-
14
-
15
-
16
-
17
-
18
-
19
-
20
-
21
-
22
-
23
-
24
-
25
-
26
-
27
-
28
-
29
-
30
-
31
-
32
-
33
-
34
-
35
-
36
-
37
-
38
-
39
-
40
-
41
-
42
-
43
-
44
-
45
-
46
-
47
-
48
-
49
-
50
-
51
-
52
-
53
-
54
-
55
-
56
-
57
-
58
-
59
-
60
-
61
-
62
-
63
-
64
-
65
-
66
-
67
-
68
-
69
-
70
-
71
-
72
-
73
-
74
-
75
-
76
-
77
-
78
-
 79
79 -
 80
80 -
 81
81 -
 82
82 -
 83
83 -
 84
84 -
 85
85 -
 86
86 -
 87
87 -
 88
88 -
 89
89 -
 90
90 -
 91
91 -
 92
92 -
 93
93 -
 94
94 -
 95
95 -
 96
96 -
 97
97 -
 98
98 -
 99
99 -
100
-
101
-
102
-
103
-
104
-
105
-
106
-
107
-
108
-
109
-
110
-
111
-
112
-
113
-
114
-
115
-
116
-
117
-
118
-
119
-
120
-
121
-
122
-
123
-
124
-
125
-
126
-
127
-
128
-
129
-
130
-
131
-
132
-
133
-
134
-
135
-
136
-
137
-
138
-
139
-
140
-
141
-
142
-
143
-
144
-
145
-
146
-
147
-
148
-
149
-
150
-
151
-
152
-
153
 |
 |

A-15
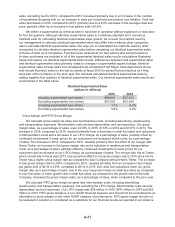
COMMON SHARE REPURCHASE PROGRAMS
We maintain share repurchase programs that comply with Rule 10b5-1 of the Securities Exchange
Act of 1934 and allow for the orderly repurchase of our common shares, from time to time. We made
open market purchases of our common shares totaling $500 million in 2015, $1.1 billion in 2014 and
$338 million in 2013 under these repurchase programs. In addition to these repurchase programs, we
also repurchase common shares to reduce dilution resulting from our employee stock option plans.
This program is solely funded by proceeds from stock option exercises, and the tax benefit from these
exercises. We repurchased approximately $203 million in 2015, $155 million in 2014 and $271 million in
2013 of our common shares under the stock option program.
The shares repurchased in 2015 were acquired under two separate share repurchase programs.
The first is a $500 million repurchase program that was authorized by our Board of Directors on June 26,
2014. The second is a program that uses the cash proceeds from the exercises of stock options by
participants in our stock option and long-term incentive plans as well as the associated tax benefits. On
June 25, 2015, our Board of Directors approved a new $500 million share repurchase program to replace
our prior authorization, which had been exhausted. As of January 30, 2016, we have not repurchased
any shares utilizing the June 25, 2015 repurchase program. On March 10, 2016, our Board of Directors
approved a new $500 million share repurchase program to supplement the 2015 Repurchase Program,
which is expected to be exhausted by the end of the second quarter of 2016.
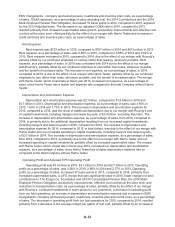
CAPITAL INVESTMENTS
Capital investments, including changes in construction-in-progress payables and excluding mergers
and the purchase of leased facilities, totaled $3.3 billion in 2015, $2.8 billion in 2014 and $2.3 billion in
2013. Capital investments for mergers totaled $168 million in 2015, $252 million in 2014 and $2.3 billion
in 2013. Payments for mergers of $168 million in 2015, $252 million in 2014 and $2.3 billion in 2013
relate to our mergers with Roundy’s, Vitacost.com and Harris Teeter, respectively. Refer to Note 2 to the
Consolidated Financial Statements for more information on the mergers with Roundy’s, Vitacost.com and
Harris Teeter. Capital investments for the purchase of leased facilities totaled $35 million in 2015, $135
million in 2014 and $108 million in 2013. The table below shows our supermarket storing activity and our
total food store square footage:
Supermarket Storing Activity
2015 2014 2013
Beginning of year 2,625 2,640 2,424
Opened 31 33 17
Opened (relocation) 12 13 7
Acquired 159 — 227
Closed (operational) (37) (48) (28)
Closed (relocation) (12) (13) (7)
End of year 2,778 2,625 2,640
Total food store square footage (in millions) 173 162 161
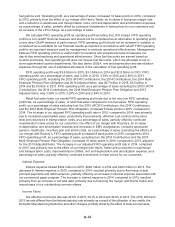
RETURN ON INVESTED CAPITAL
We calculate return on invested capital (“ROIC”) by dividing adjusted operating profit for the prior
four quarters by the average invested capital. Adjusted operating profit is calculated by excluding certain
items included in operating profit, and adding back our LIFO charge, depreciation and amortization and
rent to our U.S. GAAP operating profit of the prior four quarters. Average invested capital is calculated as
the sum of (i) the average of our total assets, (ii) the average LIFO reserve, (iii) the average accumulated
depreciation and amortization and (iv) a rent factor equal to total rent for the last four quarters multiplied
by a factor of eight; minus (i) the average taxes receivable, (ii) the average trade accounts payable,
(iii) the average accrued salaries and wages and (iv) the average other current liabilities, excluding
accrued income taxes. Averages are calculated for ROIC by adding the beginning balance of the first