Kroger 2015 Annual Report Download - page 84
Download and view the complete annual report
Please find page 84 of the 2015 Kroger annual report below. You can navigate through the pages in the report by either clicking on the pages listed below, or by using the keyword search tool below to find specific information within the annual report.-
 1
1 -
2
-
3
-
4
-
5
-
6
-
7
-
8
-
9
-
10
-
11
-
12
-
13
-
14
-
15
-
16
-
17
-
18
-
19
-
20
-
21
-
22
-
23
-
24
-
25
-
26
-
27
-
28
-
29
-
30
-
31
-
32
-
33
-
34
-
35
-
36
-
37
-
38
-
39
-
40
-
41
-
42
-
43
-
44
-
45
-
46
-
47
-
48
-
49
-
50
-
51
-
52
-
53
-
54
-
55
-
56
-
57
-
58
-
59
-
60
-
61
-
62
-
63
-
64
-
65
-
66
-
67
-
68
-
69
-
70
-
71
-
72
-
73
-
 74
74 -
 75
75 -
 76
76 -
 77
77 -
 78
78 -
 79
79 -
 80
80 -
 81
81 -
 82
82 -
 83
83 -
 84
84 -
 85
85 -
 86
86 -
 87
87 -
 88
88 -
 89
89 -
 90
90 -
 91
91 -
 92
92 -
 93
93 -
 94
94 -
95
-
96
-
97
-
98
-
99
-
100
-
101
-
102
-
103
-
104
-
105
-
106
-
107
-
108
-
109
-
110
-
111
-
112
-
113
-
114
-
115
-
116
-
117
-
118
-
119
-
120
-
121
-
122
-
123
-
124
-
125
-
126
-
127
-
128
-
129
-
130
-
131
-
132
-
133
-
134
-
135
-
136
-
137
-
138
-
139
-
140
-
141
-
142
-
143
-
144
-
145
-
146
-
147
-
148
-
149
-
150
-
151
-
152
-
153
 |
 |

A-10
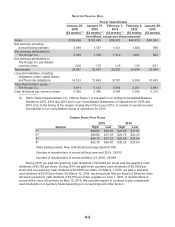
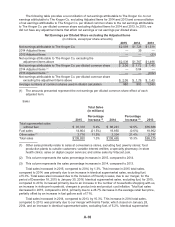
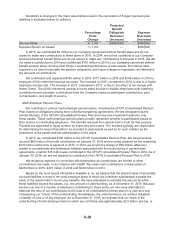
The following table provides a reconciliation of net earnings attributable to The Kroger Co. to net
earnings attributable to The Kroger Co. excluding Adjusted Items for 2014 and 2013 and a reconciliation
of net earnings attributable to The Kroger Co. per diluted common share to the net earnings attributable
to The Kroger Co. per diluted common share excluding Adjusted Items for 2014 and 2013. In 2015, we
did not have any adjustment items that affect net earnings or net earnings per diluted share.
Net Earnings per Diluted Share excluding the Adjusted Items
(in millions, except per share amounts)
2015 2014 2013
Net earnings attributable to The Kroger Co. $2,039 $1,728 $1,519
2014 Adjusted Items — 39 —
2013 Adjusted Items — — (23)
Net earnings attributable to The Kroger Co. excluding the
adjustment items above $2,039 $1,767 $1,496
Net earnings attributable to The Kroger Co. per diluted common share $ 2.06 $ 1.72 $ 1.45
2014 Adjusted Items (1) —0.04 —
2013 Adjusted Items (1) ——(0.02)
Net earnings attributable to The Kroger Co. per diluted common share
excluding the adjustment items above $ 2.06 $ 1.76 $ 1.43
Average numbers of common shares used in diluted calculation 980 993 1,040
(1) The amounts presented represent the net earnings per diluted common share effect of each
adjusted item.
Sales
Total Sales
(in millions)
2015
Percentage
Increase (2) 2014
Percentage
Increase (3) 2013
Total supermarket sales
without fuel $ 91,310 5.8% $ 86,281 12.5% $76,666
Fuel sales 14,804 (21.5%) 18,850 (0.6%) 18,962
Other sales (1) 3,716 11.5% 3,334 21.4% 2,747
Total sales $109,830 1.3% $108,465 10.3% $98,375
(1) Other sales primarily relate to sales at convenience stores, excluding fuel; jewelry stores; food
production plants to outside customers; variable interest entities; a specialty pharmacy; in-store
health clinics; sales on digital coupon services; and online sales by Vitacost.com.
(2) This column represents the sales percentage increases in 2015, compared to 2014.
(3) This column represents the sales percentage increases in 2014, compared to 2013.
Total sales increased in 2015, compared to 2014, by 1.3%. This increase in 2015 total sales,
compared to 2014, was primarily due to an increase in identical supermarket sales, excluding fuel,
of 5.0%. Total sales also increased due to the inclusion of Roundy’s sales, due to our merger, for the
period of December 18, 2015 to January 30, 2016. Identical supermarket sales, excluding fuel, for 2015,
compared to 2014, increased primarily due to an increase in the number of households shopping with us,
an increase in visits per household, changes in product mix and product cost inflation. Total fuel sales
decreased in 2015, compared to 2014, primarily due to a 26.7% decrease in the average retail fuel price,
partially offset by an increase in fuel gallons sold of 7.1%.
Total sales increased in 2014, compared to 2013, by 10.3%. This increase in 2014 total sales,
compared to 2013, was primarily due to our merger with Harris Teeter, which closed on January 28,
2014, and an increase in identical supermarket sales, excluding fuel, of 5.2%. Identical supermarket