Kroger 2015 Annual Report Download - page 142
Download and view the complete annual report
Please find page 142 of the 2015 Kroger annual report below. You can navigate through the pages in the report by either clicking on the pages listed below, or by using the keyword search tool below to find specific information within the annual report.-
 1
1 -
2
-
3
-
4
-
5
-
6
-
7
-
8
-
9
-
10
-
11
-
12
-
13
-
14
-
15
-
16
-
17
-
18
-
19
-
20
-
21
-
22
-
23
-
24
-
25
-
26
-
27
-
28
-
29
-
30
-
31
-
32
-
33
-
34
-
35
-
36
-
37
-
38
-
39
-
40
-
41
-
42
-
43
-
44
-
45
-
46
-
47
-
48
-
49
-
50
-
51
-
52
-
53
-
54
-
55
-
56
-
57
-
58
-
59
-
60
-
61
-
62
-
63
-
64
-
65
-
66
-
67
-
68
-
69
-
70
-
71
-
72
-
73
-
74
-
75
-
76
-
77
-
78
-
79
-
80
-
81
-
82
-
83
-
84
-
85
-
86
-
87
-
88
-
89
-
90
-
91
-
92
-
93
-
94
-
95
-
96
-
97
-
98
-
99
-
100
-
101
-
102
-
103
-
104
-
105
-
106
-
107
-
108
-
109
-
110
-
111
-
112
-
113
-
114
-
115
-
116
-
117
-
118
-
119
-
120
-
121
-
122
-
123
-
124
-
125
-
126
-
127
-
128
-
129
-
130
-
131
-
 132
132 -
 133
133 -
 134
134 -
 135
135 -
 136
136 -
 137
137 -
 138
138 -
 139
139 -
 140
140 -
 141
141 -
 142
142 -
 143
143 -
 144
144 -
 145
145 -
 146
146 -
 147
147 -
 148
148 -
 149
149 -
 150
150 -
 151
151 -
 152
152 -
153
 |
 |

A-68
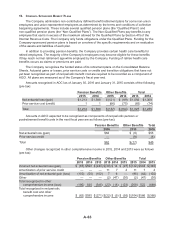
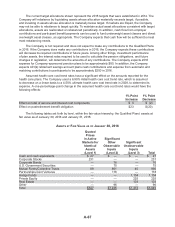
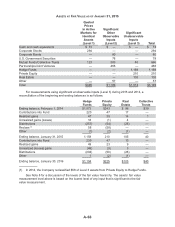
ASSETS AT FAIR VALUE AS OF JANUARY 31, 2015
Quoted
Prices
in Active
Markets for
Identical
Assets
(Level 1)
Significant
Other
Observable
Inputs
(Level 2)
Significant
Unobservable
Inputs
(Level 3) Total
Cash and cash equivalents $ 73 $ — $ — $ 73
Corporate Stocks 294 — — 294
Corporate Bonds — 80 — 80
U.S. Government Securities — 78 — 78
Mutual Funds/Collective Trusts 123 503 40 666
Partnerships/Joint Ventures — 468 — 468
Hedge Funds — — 1,158 1,158
Private Equity — — 210 210
Real Estate — — 105 105
Other — 57 — 57
Total $490 $1,186 $1,513 $3,189
For measurements using significant unobservable inputs (Level 3) during 2015 and 2014, a
reconciliation of the beginning and ending balances is as follows:
Hedge
Funds
Private
Equity
Real
Estate
Collective
Trusts
Ending balance, February 1, 2014 $1,073 $243 $ 96 $39
Contributions into Fund 220 47 17 —
Realized gains 47 35 14 1
Unrealized gains (losses) 18 (1) 4 —
Distributions (257) (54) (25) —
Reclass (1) 58 (58) — —
Other (1) (2) (1) —
Ending balance, January 31, 2015 1,158 210 105 40
Contributions into Fund 239 47 13 —
Realized gains 49 23 9 —
Unrealized (losses) gains (49) (3) 3 —
Distributions (294) (50) (26) —
Other 1 (2) (1) —
Ending balance, January 30, 2016 $1,104 $225 $103 $40
(1) In 2014, the Company reclassified $58 of Level 3 assets from Private Equity to Hedge Funds.
See Note 8 for a discussion of the levels of the fair value hierarchy. The assets’ fair value
measurement level above is based on the lowest level of any input that is significant to the fair
value measurement.