Kroger 2015 Annual Report Download - page 129
Download and view the complete annual report
Please find page 129 of the 2015 Kroger annual report below. You can navigate through the pages in the report by either clicking on the pages listed below, or by using the keyword search tool below to find specific information within the annual report.-
 1
1 -
2
-
3
-
4
-
5
-
6
-
7
-
8
-
9
-
10
-
11
-
12
-
13
-
14
-
15
-
16
-
17
-
18
-
19
-
20
-
21
-
22
-
23
-
24
-
25
-
26
-
27
-
28
-
29
-
30
-
31
-
32
-
33
-
34
-
35
-
36
-
37
-
38
-
39
-
40
-
41
-
42
-
43
-
44
-
45
-
46
-
47
-
48
-
49
-
50
-
51
-
52
-
53
-
54
-
55
-
56
-
57
-
58
-
59
-
60
-
61
-
62
-
63
-
64
-
65
-
66
-
67
-
68
-
69
-
70
-
71
-
72
-
73
-
74
-
75
-
76
-
77
-
78
-
79
-
80
-
81
-
82
-
83
-
84
-
85
-
86
-
87
-
88
-
89
-
90
-
91
-
92
-
93
-
94
-
95
-
96
-
97
-
98
-
99
-
100
-
101
-
102
-
103
-
104
-
105
-
106
-
107
-
108
-
109
-
110
-
111
-
112
-
113
-
114
-
115
-
116
-
117
-
118
-
 119
119 -
 120
120 -
 121
121 -
 122
122 -
 123
123 -
 124
124 -
 125
125 -
 126
126 -
 127
127 -
 128
128 -
 129
129 -
 130
130 -
 131
131 -
 132
132 -
 133
133 -
 134
134 -
 135
135 -
 136
136 -
 137
137 -
 138
138 -
 139
139 -
140
-
141
-
142
-
143
-
144
-
145
-
146
-
147
-
148
-
149
-
150
-
151
-
152
-
153
 |
 |

A-55
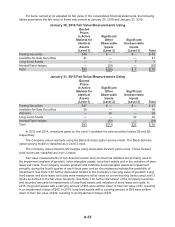
For items carried at (or adjusted to) fair value in the consolidated financial statements, the following
tables summarize the fair value of these instruments at January 30, 2016 and January 31, 2015:
January 30, 2016 Fair Value Measurements Using
Quoted
Prices
in Active
Markets for
Identical
Assets
(Level 1)
Significant
Other
Observable
Inputs
(Level 2)
Significant
Unobservable
Inputs
(Level 3) Total
Trading Securities $48 $ — $ — $ 48
Available-for-Sale Securities 41 — — 41
Long-Lived Assets — — 7 7
Interest Rate Hedges — (26) — (26)
Total $89 $(26) $ 7 $ 70
January 31, 2015 Fair Value Measurements Using
Quoted
Prices
in Active
Markets for
Identical
Assets
(Level 1)
Significant
Other
Observable
Inputs
(Level 2)
Significant
Unobservable
Inputs
(Level 3) Total
Trading Securities $47 $ — $ — $ 47
Available-for-Sale Securities 36 — — 36
Warrants — 26 — 26
Long-Lived Assets — — 22 22
Interest Rate Hedges — (39) — (39)
Total $83 $(13) $22 $ 92
In 2015 and 2014, unrealized gains on the Level 1 available-for-sale securities totaled $5 and $8,
respectively.
The Company values warrants using the Black-Scholes option-pricing model. The Black-Scholes
option-pricing model is classified as a Level 2 input.
The Company values interest rate hedges using observable forward yield curves. These forward
yield curves are classified as Level 2 inputs.
Fair value measurements of non-financial assets and non-financial liabilities are primarily used in
the impairment analysis of goodwill, other intangible assets, long-lived assets and in the valuation of store
lease exit costs. The Company reviews goodwill and indefinite-lived intangible assets for impairment
annually, during the fourth quarter of each fiscal year, and as circumstances indicate the possibility of
impairment. See Note 3 for further discussion related to the Company’s carrying value of goodwill. Long-
lived assets and store lease exit costs were measured at fair value on a nonrecurring basis using Level 3
inputs as defined in the fair value hierarchy. See Note 1 for further discussion of the Company’s policies
and recorded amounts for impairments of long-lived assets and valuation of store lease exit costs. In
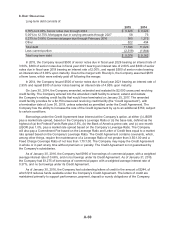
2015, long-lived assets with a carrying amount of $53 were written down to their fair value of $7, resulting
in an impairment charge of $46. In 2014, long-lived assets with a carrying amount of $59 were written
down to their fair value of $22, resulting in an impairment charge of $37.