Kroger 2015 Annual Report Download - page 82
Download and view the complete annual report
Please find page 82 of the 2015 Kroger annual report below. You can navigate through the pages in the report by either clicking on the pages listed below, or by using the keyword search tool below to find specific information within the annual report.-
 1
1 -
2
-
3
-
4
-
5
-
6
-
7
-
8
-
9
-
10
-
11
-
12
-
13
-
14
-
15
-
16
-
17
-
18
-
19
-
20
-
21
-
22
-
23
-
24
-
25
-
26
-
27
-
28
-
29
-
30
-
31
-
32
-
33
-
34
-
35
-
36
-
37
-
38
-
39
-
40
-
41
-
42
-
43
-
44
-
45
-
46
-
47
-
48
-
49
-
50
-
51
-
52
-
53
-
54
-
55
-
56
-
57
-
58
-
59
-
60
-
61
-
62
-
63
-
64
-
65
-
66
-
67
-
68
-
69
-
70
-
71
-
 72
72 -
 73
73 -
 74
74 -
 75
75 -
 76
76 -
 77
77 -
 78
78 -
 79
79 -
 80
80 -
 81
81 -
 82
82 -
 83
83 -
 84
84 -
 85
85 -
 86
86 -
 87
87 -
 88
88 -
 89
89 -
 90
90 -
 91
91 -
 92
92 -
93
-
94
-
95
-
96
-
97
-
98
-
99
-
100
-
101
-
102
-
103
-
104
-
105
-
106
-
107
-
108
-
109
-
110
-
111
-
112
-
113
-
114
-
115
-
116
-
117
-
118
-
119
-
120
-
121
-
122
-
123
-
124
-
125
-
126
-
127
-
128
-
129
-
130
-
131
-
132
-
133
-
134
-
135
-
136
-
137
-
138
-
139
-
140
-
141
-
142
-
143
-
144
-
145
-
146
-
147
-
148
-
149
-
150
-
151
-
152
-
153
 |
 |
A-8
Items”). In addition, our net earnings for 2014 include unusually high fuel margins, partially offset by a
LIFO charge that was significantly higher than 2013 and $140 million in contributions charged to OG&A
expenses for the UFCW Consolidated Pension Plan ($55 million) and The Kroger Co. Foundation ($85 million)
(“2014 Contributions”). The 2015 and 2014 contributions to the UFCW Consolidated Pension Plan was to
further fund the plan. The $85 million contribution, in 2014, to The Kroger Co. Foundation will enable it to
continue to support causes such as hunger relief, breast cancer awareness, the military and their families and
local community organizations. Fuel margin per gallon was $0.19 in 2014, compared to $0.14 in 2013. Our net
earnings for 2013 include a net benefit of $23 million, which includes benefits from certain tax items of $40
million, offset partially by costs of $11 million in interest and $16 million in OG&A expenses ($17 million after-
tax) related to our merger with Harris Teeter (“2013 Adjusted Items”).
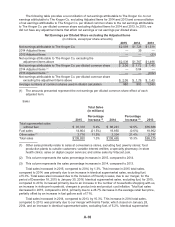
Our 2015 net earnings were $2.0 billion or $2.06 per diluted share, compared to $1.7 billion, or
$1.72 per diluted share for 2014. Net earnings for 2015 totaled $2.0 billion, or $2.06 per diluted share,
compared to net earnings in 2014 of $1.8 billion, or $1.76 per diluted share, excluding the 2014 Adjusted
Items. We believe adjusted net earnings and adjusted net earnings per diluted share present a more
accurate year-over-year comparison of our financial results because the 2014 Adjusted Items were
not the result of our normal operations. Our net earnings per diluted share for 2015 represent a 17%
increase, compared to 2014 adjusted net earnings per diluted share. Please refer to the “Net Earnings”
section of MD&A for more information.
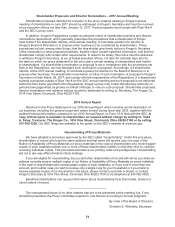
Our identical supermarket sales increased 5.0%, excluding fuel, in 2015, compared to 2014. We
have achieved 49 consecutive quarters of positive identical supermarket sales growth, excluding fuel.
As we continue to outpace many of our competitors on identical supermarket sales growth, we continue
to gain market share. We focus on identical supermarket sales growth, excluding fuel, as it is a key
performance target for our long-term growth strategy.
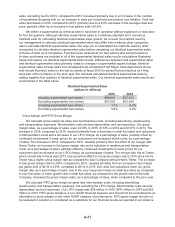
Increasing market share is an important part of our long-term strategy as it best reflects how our
products and services resonate with customers. Market share growth allows us to spread the fixed costs
in our business over a wider revenue base. Our fundamental operating philosophy is to maintain and
increase market share by offering customers good prices and superior products and service. Based
on Nielsen POS+ data, our overall market share of the products we sell in markets in which we operate
increased by approximately 40 basis points in 2015. This data also indicates that our market share
increased in 17 markets and declined in one. These market share results reflect our long-term strategy of
market share growth.
RESULTS OF OPERATIONS
The following discussion summarizes our operating results for 2015 compared to 2014 and for 2014
compared to 2013. Comparability is affected by income and expense items that fluctuated significantly
between and among the periods, our merger with Roundy’s in late 2015 and our merger with Harris
Teeter in late 2013. All share and per share amounts presented below are reflective of the two-for-one
stock split that began trading at the split adjusted price on July 14, 2015.
Management believes adjusted net earnings (and adjusted net earnings per diluted share) are
useful metrics to investors and analysts because they more accurately reflect our day-to-day business
operations than do the generally accepted accounting principle (“GAAP”) measures of net earnings
and net earnings per diluted share. Adjusted net earnings (and adjusted net earnings per diluted share)
are non-generally accepted accounting principle (“non-GAAP”) financial measures and should not
be considered alternatives to net earnings (and net earnings per diluted share) or any other GAAP
measure of performance. Adjusted net earnings (and adjusted net earnings per diluted share) should
not be viewed in isolation or considered substitutes for our financial results as reported in accordance
with GAAP. Management uses adjusted net earnings (and adjusted net earnings per diluted share)
in evaluating our results of operations as it believes these measures are more meaningful indicators
of operating performance since, as adjusted, those earnings relate more directly to our day-to-day
operations. Management also uses adjusted net earnings (and adjusted net earnings per diluted share)
as a performance metric for management incentive programs, and to measure our progress against
internal budgets and targets.