Kroger 2015 Annual Report Download - page 29
Download and view the complete annual report
Please find page 29 of the 2015 Kroger annual report below. You can navigate through the pages in the report by either clicking on the pages listed below, or by using the keyword search tool below to find specific information within the annual report.-
 1
1 -
2
-
3
-
4
-
5
-
6
-
7
-
8
-
9
-
10
-
11
-
12
-
13
-
14
-
15
-
16
-
17
-
18
-
 19
19 -
 20
20 -
 21
21 -
 22
22 -
 23
23 -
 24
24 -
 25
25 -
 26
26 -
 27
27 -
 28
28 -
 29
29 -
 30
30 -
 31
31 -
 32
32 -
 33
33 -
 34
34 -
 35
35 -
 36
36 -
 37
37 -
 38
38 -
 39
39 -
40
-
41
-
42
-
43
-
44
-
45
-
46
-
47
-
48
-
49
-
50
-
51
-
52
-
53
-
54
-
55
-
56
-
57
-
58
-
59
-
60
-
61
-
62
-
63
-
64
-
65
-
66
-
67
-
68
-
69
-
70
-
71
-
72
-
73
-
74
-
75
-
76
-
77
-
78
-
79
-
80
-
81
-
82
-
83
-
84
-
85
-
86
-
87
-
88
-
89
-
90
-
91
-
92
-
93
-
94
-
95
-
96
-
97
-
98
-
99
-
100
-
101
-
102
-
103
-
104
-
105
-
106
-
107
-
108
-
109
-
110
-
111
-
112
-
113
-
114
-
115
-
116
-
117
-
118
-
119
-
120
-
121
-
122
-
123
-
124
-
125
-
126
-
127
-
128
-
129
-
130
-
131
-
132
-
133
-
134
-
135
-
136
-
137
-
138
-
139
-
140
-
141
-
142
-
143
-
144
-
145
-
146
-
147
-
148
-
149
-
150
-
151
-
152
-
153
 |
 |

27
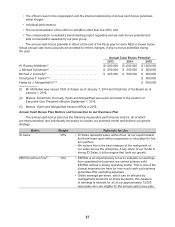
• The officer’s level in the organization and the internal relationship of annual cash bonus potentials
within Kroger;
• Individual performance;
• The recommendation of the CEO for all NEOs other than the CEO; and
• The compensation consultant’s benchmarking report regarding annual cash bonus potential and
total compensation awarded by our peer group.
The annual cash bonus potential in effect at the end of the fiscal year for each NEO is shown below.
Actual annual cash bonus payouts are prorated to reflect changes, if any, to bonus potentials during
the year.
Annual Cash Bonus Potential
2013 2014 2015
W. Rodney McMullen(1) . . . . . . . . . . . . . . . . . . . . . . . . . . . . . . $1,500,000 $1,600,000 $1,650,000
J. Michael Schlotman(2) . . . . . . . . . . . . . . . . . . . . . . . . . . . . . . $ 550,000 $ 550,000 $ 600,000
Michael J. Donnelly(2) . . . . . . . . . . . . . . . . . . . . . . . . . . . . . . . . $ 425,000 $ 550,000 $ 600,000
Christopher T. Hjelm(2)(3) . . . . . . . . . . . . . . . . . . . . . . . . . . . . . . $ 600,000
Frederick J. Morganthall II(2)(3) . . . . . . . . . . . . . . . . . . . . . . . . . $ 600,000
(1) Mr. McMullen was named CEO of Kroger as of January 1, 2014 and Chairman of the Board as of
January 1, 2015.
(2) Messrs. Schlotman, Donnelly, Hjelm and Morganthall were each promoted to the position of
Executive Vice President effective September 1, 2015.
(3) Messrs. Hjelm and Morganthall became NEOs in 2015.
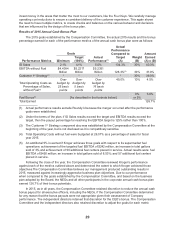
Annual Cash Bonus Plan Metrics and Connection to our Business Plan
The annual cash bonus plan has the following measurable performance metrics, all of which
are interconnected, and individually necessary to sustain our business model and achieve our growth
strategy:
Metric Weight Rationale for Use
ID Sales 30% • ID Sales represent sales, without fuel, at our supermarkets
that have been open without expansion or relocation for five
full quarters.
• We believe this is the best measure of the real growth of
our sales across the enterprise. A key driver of our model is
strong ID Sales; it is the engine that fuels our growth.
EBITDA without Fuel(1) 30% • EBITDA is an important way for us to evaluate our earnings
from operating the business; we cannot achieve solid
EBITDA without a strong operating model. This is one of the
closest measures we have for how much cash our business
generates after operating expenses.
• Unlike earnings per share, which can be affected by
management decisions on share buybacks, this measure
of earnings is relevant for all of our approximately 13,000
associates who are eligible for the annual cash bonus plan.