Kroger 2015 Annual Report Download - page 46
Download and view the complete annual report
Please find page 46 of the 2015 Kroger annual report below. You can navigate through the pages in the report by either clicking on the pages listed below, or by using the keyword search tool below to find specific information within the annual report.-
 1
1 -
2
-
3
-
4
-
5
-
6
-
7
-
8
-
9
-
10
-
11
-
12
-
13
-
14
-
15
-
16
-
17
-
18
-
19
-
20
-
21
-
22
-
23
-
24
-
25
-
26
-
27
-
28
-
29
-
30
-
31
-
32
-
33
-
34
-
35
-
 36
36 -
 37
37 -
 38
38 -
 39
39 -
 40
40 -
 41
41 -
 42
42 -
 43
43 -
 44
44 -
 45
45 -
 46
46 -
 47
47 -
 48
48 -
 49
49 -
 50
50 -
 51
51 -
 52
52 -
 53
53 -
 54
54 -
 55
55 -
 56
56 -
57
-
58
-
59
-
60
-
61
-
62
-
63
-
64
-
65
-
66
-
67
-
68
-
69
-
70
-
71
-
72
-
73
-
74
-
75
-
76
-
77
-
78
-
79
-
80
-
81
-
82
-
83
-
84
-
85
-
86
-
87
-
88
-
89
-
90
-
91
-
92
-
93
-
94
-
95
-
96
-
97
-
98
-
99
-
100
-
101
-
102
-
103
-
104
-
105
-
106
-
107
-
108
-
109
-
110
-
111
-
112
-
113
-
114
-
115
-
116
-
117
-
118
-
119
-
120
-
121
-
122
-
123
-
124
-
125
-
126
-
127
-
128
-
129
-
130
-
131
-
132
-
133
-
134
-
135
-
136
-
137
-
138
-
139
-
140
-
141
-
142
-
143
-
144
-
145
-
146
-
147
-
148
-
149
-
150
-
151
-
152
-
153
 |
 |

44
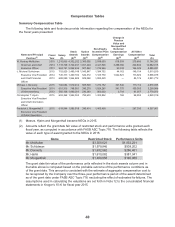
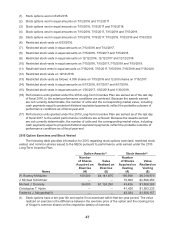
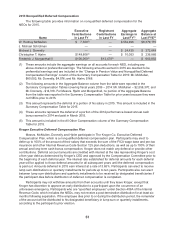
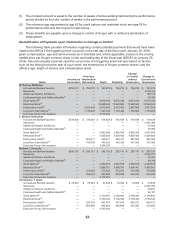
2015 Grants of Plan-Based Awards
The following table provides information about equity and non-equity incentive awards granted to
the NEOs in 2015.
Name
Grant
Date
Estimated Future Payouts
Under Non-Equity
Incentive Plan Awards
Estimated Future
Payouts Under
Equity Incentive
Plan Awards
All Other
Stock
Awards:
Number of
Shares of
Stock or
Units
(#)(4)
All Other
Option
Awards:
Number of
Securities
Underlying
Options
(#)(5)
Exercise
or Base
Price of
Option
Awards
($/Sh)
Grant
Date Fair
Value of
Stock
and
Option
Awards
Target
($)
Maximum
($)
Target
(#)
Maximum
(#)
W. Rodney $1,625,962 (1) $3,251,924(1)
McMullen $ 600,000 (2) $1,200,000(2)
7/15/2015 86,095 $3,300,021
7/15/2015 235,415 $ 38.33 $2,300,092
7/15/2015 26,090(3) 52,179(3) $1,032,231
J. Michael $ 571,154 (1) $1,142,308(1)
Schlotman $ 380,000 (2) $ 760,000(2)
7/15/2015 38,610 $1,479,921
9/17/2015 13,334 $ 500,025
7/15/2015 106,531 $ 38.33 $1,040,847
7/15/2015 12,870(3) 25,740(3) $ 509,202
Michael J. $ 571,154 (1) $1,142,308(1)
Donnelly $ 331,450 (2) $ 662,900(2)
7/15/2015 29,547 $1,132,537
9/17/2015 13,334 $ 500,025
7/15/2015 59,929 $ 38.33 $ 585,529
7/15/2015 7,240(3) 14,480(3) $ 286,451
Christopher T. $ 571,154 (1) $1,142,308(1)
Hjelm $ 310,000 (2) $ 620,000(2)
7/15/2015 28,960 $ 1,110,037
9/17/2015 13,334 $ 500,025
7/15/2015 79,898 $ 38.33 $ 780,633
7/15/2015 9,654(3) 19,307(3) $ 381,941
Frederick J. $ 577,769 (1) $1,155,538(1)
Morganthall II $ 285,117 (2) $ 570,234(2)
7/15/2015 23,609 $ 904,933
9/17/2015 13,334 $ 500,025
7/15/2015 39,959 $ 38.33 $ 390,414
7/15/2015 4,827(3) 9,653(3) $ 190,960
(1) These amounts relate to the 2015 performance-based annual cash bonus plan. The amount
listed under “Target” represents the annual cash bonus potential of the NEO. By the terms of the
plan, payouts are limited to no more than 200% of a participant’s annual cash bonus potential;
accordingly, the amount listed under “Maximum” equals two times that officer’s annual cash bonus
potential amount. In the event that a participant’s annual cash bonus potential is increased during
the year following the annual compensation review and/or a promotion, the target and maximum
amounts are prorated to reflect the increase. Accordingly, the amounts reported for each NEO
reflect the prorated targets and maximums. The amounts actually earned under this plan were paid
in March 2016 and are included in the Summary Compensation Table for 2015 in the “Non-Equity
Incentive Plan Compensation” column and are described in footnote 4 to that table.