Kroger 2015 Annual Report Download - page 48
Download and view the complete annual report
Please find page 48 of the 2015 Kroger annual report below. You can navigate through the pages in the report by either clicking on the pages listed below, or by using the keyword search tool below to find specific information within the annual report.-
 1
1 -
2
-
3
-
4
-
5
-
6
-
7
-
8
-
9
-
10
-
11
-
12
-
13
-
14
-
15
-
16
-
17
-
18
-
19
-
20
-
21
-
22
-
23
-
24
-
25
-
26
-
27
-
28
-
29
-
30
-
31
-
32
-
33
-
34
-
35
-
36
-
37
-
 38
38 -
 39
39 -
 40
40 -
 41
41 -
 42
42 -
 43
43 -
 44
44 -
 45
45 -
 46
46 -
 47
47 -
 48
48 -
 49
49 -
 50
50 -
 51
51 -
 52
52 -
 53
53 -
 54
54 -
 55
55 -
 56
56 -
 57
57 -
 58
58 -
59
-
60
-
61
-
62
-
63
-
64
-
65
-
66
-
67
-
68
-
69
-
70
-
71
-
72
-
73
-
74
-
75
-
76
-
77
-
78
-
79
-
80
-
81
-
82
-
83
-
84
-
85
-
86
-
87
-
88
-
89
-
90
-
91
-
92
-
93
-
94
-
95
-
96
-
97
-
98
-
99
-
100
-
101
-
102
-
103
-
104
-
105
-
106
-
107
-
108
-
109
-
110
-
111
-
112
-
113
-
114
-
115
-
116
-
117
-
118
-
119
-
120
-
121
-
122
-
123
-
124
-
125
-
126
-
127
-
128
-
129
-
130
-
131
-
132
-
133
-
134
-
135
-
136
-
137
-
138
-
139
-
140
-
141
-
142
-
143
-
144
-
145
-
146
-
147
-
148
-
149
-
150
-
151
-
152
-
153
 |
 |

46
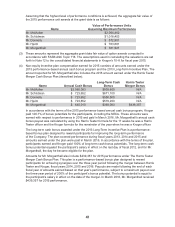
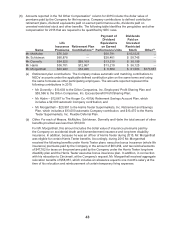
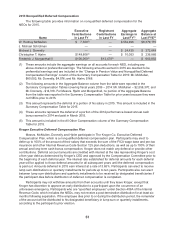
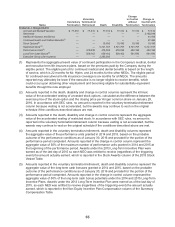
2015 Outstanding Equity Awards at Fiscal Year-End
The following table provides information about outstanding equity-based incentive compensation awards
for the NEOs as of the end of 2015. The vesting schedule for each award is described in the footnotes to this
table. The market value of unvested restricted stock and unearned performance units is based on the closing
price of Kroger’s common shares of $38.81 on January 29, 2016, the last trading day of 2015.
Option Awards Stock Awards
Name
Number of
Securities
Underlying
Unexercised
Options
Exercisable
(#)
Number of
Securities
Underlying
Unexercised
Options
Unexercisable
(#)
Option
Exercise
Price
($)
Option
Expiration
Date
Number
of Shares
or Units of
Stock That
Have Not
Vested
(#)
Market Value
of Shares
or Units of
Stock That
Have Not
Vested
($)
Equity
Incentive
Plan Awards:
Number of
Unearned
Shares,
Units or
Other Rights
That Have
Not Vested
(#)
Equity
Incentive Plan
Awards: Market
or Payout Value
of Unearned
Shares, Units
or Other Rights
That Have Not
Vested
($)
W. Rodney 120,000 — $ 9.97 5/4/2016 13,716(6) 532,318 73,875(16) 2,952,414(16)
McMullen 120,000 — $ 14.14 6/28/2017 29,232(7) 1,134,494 26,090(17) 1,044,754(17)
130,000 — $ 14.31 6/26/2018 43,848(8) 1,701,741
130,000 — $ 11.17 6/25/2019 96,000(9) 3,725,760
140,000 — $ 10.08 6/24/2020 90,000(10) 3,492,900
146,304 36,576(1) $ 12.37 6/23/2021 86,095(11) 3,341,347
116,928 77,952(2) $ 10.98 7/12/2022
77,952 116,928(3) $ 18.88 7/15/2023
60,000 240,000(4) $ 24.67 7/15/2024
— 235,415(5) $ 38.33 7/15/2025
J. Michael 50,000 — $ 10.08 6/24/2020 6,846(6) 265,693 19,700(16) 787,311(16)
Schlotman 73,024 18,256(1) $ 12.37 6/23/2021 16,392(7) 636,174 12,870(17) 515,379(17)
65,568 43,712(2) $ 10.98 7/12/2022 24,588(8) 954,260
43,712 65,568(3) $ 18.88 7/15/2023 13,000(12) 504,530
16,000 64,000(4) $ 24.67 7/15/2024 16,000(13) 620,960
— 106,531(5) $ 38.33 7/15/2025 24,000(10) 931,440
38,610(11) 1,498,454
13,334(14) 517,493
Michael J. 40,000 — $ 14.14 6/28/2017 4,804(6) 186,443 14,775(16) 590,483(16)
Donnelly 40,000 — $ 14.31 6/26/2018 7,608(7) 295,266 7,240(17) 289,926(17)
40,000 — $ 11.17 6/25/2019 14,412(8) 559,330
40,000 — $ 10.08 6/24/2020 13,000(12) 504,530
56,576 14,144(1) $ 12.37 6/23/2021 18,000(10) 698,580
30,432 20,288(2) $ 10.98 7/12/2022 29,547(11) 1,146,719
20,288 30,432(3) $ 18.88 7/15/2023 13,334(14) 517,493
12,000 48,000(4) $ 24.67 7/15/2024
— 59,929(5) $ 38.33 7/15/2025
Christopher T. 8,000 — $ 14.31 6/26/2018 3,804(6) 147,633 14,775(16) 590,483(16)
Hjelm 16,000 — $ 11.17 6/25/2019 7,608(7) 295,266 9,654(17) 386,574(17)
24,000 — $ 10.08 6/24/2020 11,412(8) 442,900
30,432 10,144(1) $ 12.37 6/23/2021 13,000(12) 504,530
30,432 20,288(2) $ 10.98 7/12/2022 18,000(10) 698,580
20,288 30,432(3) $ 18.88 7/15/2023 28,960(11) 1,123,938
12,000 48,000(4) $ 24.67 7/15/2024 13,334(14) 517,493
— 79,898(5) $ 38.33 7/15/2025
Frederick J. — 39,959(5) $ 38.33 7/15/2025 75,778(15) 2,940,944 13,445(16) 537,339(16)
Morganthall II 34,710(10) 1,347,095 4,827(17) 193,277(17)
9,132(8) 354,413
14,477(11) 561,852
13,334(14) 517,493