Kroger 2015 Annual Report Download - page 134
Download and view the complete annual report
Please find page 134 of the 2015 Kroger annual report below. You can navigate through the pages in the report by either clicking on the pages listed below, or by using the keyword search tool below to find specific information within the annual report.-
 1
1 -
2
-
3
-
4
-
5
-
6
-
7
-
8
-
9
-
10
-
11
-
12
-
13
-
14
-
15
-
16
-
17
-
18
-
19
-
20
-
21
-
22
-
23
-
24
-
25
-
26
-
27
-
28
-
29
-
30
-
31
-
32
-
33
-
34
-
35
-
36
-
37
-
38
-
39
-
40
-
41
-
42
-
43
-
44
-
45
-
46
-
47
-
48
-
49
-
50
-
51
-
52
-
53
-
54
-
55
-
56
-
57
-
58
-
59
-
60
-
61
-
62
-
63
-
64
-
65
-
66
-
67
-
68
-
69
-
70
-
71
-
72
-
73
-
74
-
75
-
76
-
77
-
78
-
79
-
80
-
81
-
82
-
83
-
84
-
85
-
86
-
87
-
88
-
89
-
90
-
91
-
92
-
93
-
94
-
95
-
96
-
97
-
98
-
99
-
100
-
101
-
102
-
103
-
104
-
105
-
106
-
107
-
108
-
109
-
110
-
111
-
112
-
113
-
114
-
115
-
116
-
117
-
118
-
119
-
120
-
121
-
122
-
123
-
 124
124 -
 125
125 -
 126
126 -
 127
127 -
 128
128 -
 129
129 -
 130
130 -
 131
131 -
 132
132 -
 133
133 -
 134
134 -
 135
135 -
 136
136 -
 137
137 -
 138
138 -
 139
139 -
 140
140 -
 141
141 -
 142
142 -
 143
143 -
 144
144 -
145
-
146
-
147
-
148
-
149
-
150
-
151
-
152
-
153
 |
 |

A-60
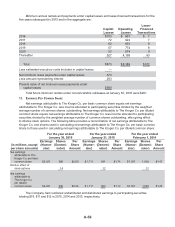
A summary of options outstanding, exercisable and expected to vest at January 30, 2016 follows:
Number of
shares
Weighted-
average
remaining
contractual
life
Weighted-
average
exercise
price
Aggregate
intrinsic
value
(in millions) (in years) (in millions)
Options Outstanding 34.9 6.20 $18.26 719
Options Exercisable 21.4 5.05 $14.24 526
Options Expected to Vest 13.2 8.02 $24.53 189
Restricted stock
Changes in restricted stock outstanding under the restricted stock plans are summarized below:
Restricted
shares
outstanding
(in millions)
Weighted-
average
grant-date
fair value
Outstanding, year-end 2012 8.6 $ 11.34
Granted 6.3 $18.84
Lapsed (5.1) $11.49
Canceled or Expired (0.2) $13.66
Outstanding, year-end 2013 9.6 $16.16
Granted 6.1 $24.76
Lapsed (5.2) $16.52
Canceled or Expired (0.3) $18.67
Outstanding, year-end 2014 10.2 $21.04
Granted 3.2 $38.34
Lapsed (5.4) $21.49
Canceled or Expired (0.4) $22.80
Outstanding, year-end 2015 7.6 $28.01
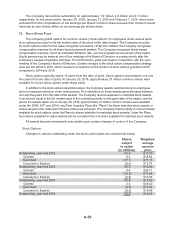
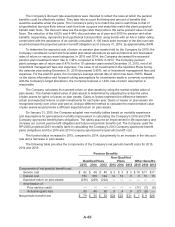
The weighted-average grant date fair value of stock options granted during 2015, 2014 and 2013
was $9.78, $5.98 and $4.49, respectively. The fair value of each stock option grant was estimated on
the date of grant using the Black-Scholes option-pricing model, based on the assumptions shown in the
table below. The Black-Scholes model utilizes accounting judgment and financial estimates, including
the term option holders are expected to retain their stock options before exercising them, the volatility of
the Company’s share price over that expected term, the dividend yield over the term and the number of
awards expected to be forfeited before they vest. Using alternative assumptions in the calculation of fair
value would produce fair values for stock option grants that could be different than those used to record
stock-based compensation expense in the Consolidated Statements of Operations. The increase in the
fair value of the stock options granted during 2015, compared to 2014, resulted primarily from an increase
in the Company’s share price, which decreased the expected dividend yield. The increase in the fair
value of the stock options granted during 2014, compared to 2013, resulted primarily from an increase
in the Company’s share price, which decreased the expected dividend yield, and an increase in the
weighted average risk-free interest rate.