Kroger 2015 Annual Report Download - page 31
Download and view the complete annual report
Please find page 31 of the 2015 Kroger annual report below. You can navigate through the pages in the report by either clicking on the pages listed below, or by using the keyword search tool below to find specific information within the annual report.-
 1
1 -
2
-
3
-
4
-
5
-
6
-
7
-
8
-
9
-
10
-
11
-
12
-
13
-
14
-
15
-
16
-
17
-
18
-
19
-
20
-
 21
21 -
 22
22 -
 23
23 -
 24
24 -
 25
25 -
 26
26 -
 27
27 -
 28
28 -
 29
29 -
 30
30 -
 31
31 -
 32
32 -
 33
33 -
 34
34 -
 35
35 -
 36
36 -
 37
37 -
 38
38 -
 39
39 -
 40
40 -
 41
41 -
42
-
43
-
44
-
45
-
46
-
47
-
48
-
49
-
50
-
51
-
52
-
53
-
54
-
55
-
56
-
57
-
58
-
59
-
60
-
61
-
62
-
63
-
64
-
65
-
66
-
67
-
68
-
69
-
70
-
71
-
72
-
73
-
74
-
75
-
76
-
77
-
78
-
79
-
80
-
81
-
82
-
83
-
84
-
85
-
86
-
87
-
88
-
89
-
90
-
91
-
92
-
93
-
94
-
95
-
96
-
97
-
98
-
99
-
100
-
101
-
102
-
103
-
104
-
105
-
106
-
107
-
108
-
109
-
110
-
111
-
112
-
113
-
114
-
115
-
116
-
117
-
118
-
119
-
120
-
121
-
122
-
123
-
124
-
125
-
126
-
127
-
128
-
129
-
130
-
131
-
132
-
133
-
134
-
135
-
136
-
137
-
138
-
139
-
140
-
141
-
142
-
143
-
144
-
145
-
146
-
147
-
148
-
149
-
150
-
151
-
152
-
153
 |
 |

29
invest money in the areas that matter the most to our customers, like the Four Keys. We carefully manage
operating cost reductions to ensure a consistent delivery of the customer experience. This again shows
the need to have multiple metrics, to create checks and balances on the various behavior and decisions
that are influenced by the design of the bonus plan.
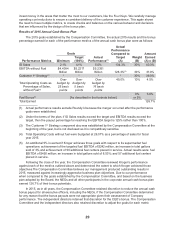
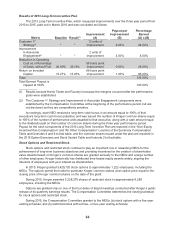
Results of 2015 Annual Cash Bonus Plan
The 2015 goals established by the Compensation Committee, the actual 2015 results and the bonus
percentage earned for each of the performance metrics of the annual cash bonus plan were as follows:
Performance Metrics
Goals
Actual
Performance(1)
Actual
Performance
Compared to
Target
(A)
Weight
(B)
Amount
Earned
(A) x (B)Minimum
Target
(100%)
ID Sales 2.1% 4.1% 5.0% 13 4.3% 30% 40.3%
EBITDA without Fuel $4.4384
Billion
$5.2217
Billion
$5.2351
Billion 126.3%(2) 30% 37.9%
Customer 1st Strategy(3) ** * *30%39.0%
Total Operating Costs as
Percentage of Sales,
without Fuel(4)
Over
budget by
25 basis
points
Over
budget by
5 basis
points
Over
budget by
16 basis
points
45.0% 10% 4.5%
Fuel Bonus(5) [As described in the footnote below]
0%
or 5%
5.0%
Total Earned 126.7%
(1) Actual performance results exclude Roundy’s because the merger occurred after the performance
goals were established.
(2) Under the terms of the plan, if ID Sales results exceed the target and EBITDA results exceed the
target, then the payout percentage for reaching the EBITDA target is 125% rather than 100%.
(3) The Customer 1st Strategy component also was established by the Compensation Committee at the
beginning of the year, but is not disclosed as it is competitively sensitive.
(4) Total Operating Costs without fuel were budgeted at 26.07% as a percentage of sales for fiscal
year 2015.
(5) An additional 5% is earned if Kroger achieves three goals with respect to its supermarket fuel
operations: achievement of the targeted fuel EBITDA of $242 million, an increase in total gallons
sold of 3%,and achievement of 50 additional fuel centers placed in service. Actual results were: fuel
EBITDA of $450 million; an increase in total gallons sold of 8.53%; and 57 additional fuel centers
placed in service.
Following the close of the year, the Compensation Committee reviewed Kroger’s performance
against each of the metrics outlined above and determined the extent to which Kroger achieved those
objectives.The Compensation Committee believes our management produced outstanding results in
2015, measured against increasingly aggressive business plan objectives. Due to our performance
when compared to the goals established by the Compensation Committee, and based on the business
plan adopted by the Board, the NEOs and all other participants in the corporate annual cash bonus plan
earned 126.7% of their bonus potentials.
In 2015, as in all years, the Compensation Committee retained discretion to reduce the annual cash
bonus payout for all executive officers, including the NEOs, if the Compensation Committee determined
for any reason that the bonus payouts were not appropriate given their assessment of Company
performance. The independent directors retained that discretion for the CEO’s bonus. The Compensation
Committee and the independent directors also retained discretion to adjust the goals for each metric