Kroger 2015 Annual Report Download - page 98
Download and view the complete annual report
Please find page 98 of the 2015 Kroger annual report below. You can navigate through the pages in the report by either clicking on the pages listed below, or by using the keyword search tool below to find specific information within the annual report.-
 1
1 -
2
-
3
-
4
-
5
-
6
-
7
-
8
-
9
-
10
-
11
-
12
-
13
-
14
-
15
-
16
-
17
-
18
-
19
-
20
-
21
-
22
-
23
-
24
-
25
-
26
-
27
-
28
-
29
-
30
-
31
-
32
-
33
-
34
-
35
-
36
-
37
-
38
-
39
-
40
-
41
-
42
-
43
-
44
-
45
-
46
-
47
-
48
-
49
-
50
-
51
-
52
-
53
-
54
-
55
-
56
-
57
-
58
-
59
-
60
-
61
-
62
-
63
-
64
-
65
-
66
-
67
-
68
-
69
-
70
-
71
-
72
-
73
-
74
-
75
-
76
-
77
-
78
-
79
-
80
-
81
-
82
-
83
-
84
-
85
-
86
-
87
-
 88
88 -
 89
89 -
 90
90 -
 91
91 -
 92
92 -
 93
93 -
 94
94 -
 95
95 -
 96
96 -
 97
97 -
 98
98 -
 99
99 -
 100
100 -
 101
101 -
 102
102 -
 103
103 -
 104
104 -
 105
105 -
 106
106 -
 107
107 -
 108
108 -
109
-
110
-
111
-
112
-
113
-
114
-
115
-
116
-
117
-
118
-
119
-
120
-
121
-
122
-
123
-
124
-
125
-
126
-
127
-
128
-
129
-
130
-
131
-
132
-
133
-
134
-
135
-
136
-
137
-
138
-
139
-
140
-
141
-
142
-
143
-
144
-
145
-
146
-
147
-
148
-
149
-
150
-
151
-
152
-
153
 |
 |

A-24
The increase in net cash provided by operating activities in 2014, compared to 2013, resulted
primarily due to an increase in net earnings including non-controlling interests, which include the results
of Harris Teeter, an increase in non-cash items, a reduction in contributions to Company-sponsored
pension plans and changes in working capital. The increase in non-cash items in 2014, as compared to
2013, was primarily due to increases in depreciation and amortization expense and the LIFO charge. The
amount of cash paid for income taxes increased in 2014, compared to 2013, primarily due to an increase
in net earnings including non-controlling interests.
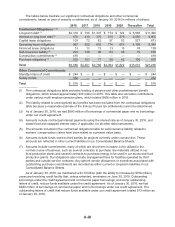
Cash provided (used) by operating activities for changes in working capital was $96 million in 2015,
compared to ($49) million in 2014 and $63 million in 2013. The increase in cash provided by operating
activities for changes in working capital in 2015, compared to 2014, was primarily due to an increase in
cash provided by trade accounts payables and store deposits in transit, partially offset by a decrease in
cash provided by income taxes receivable and payable. The increase in cash used by operating activities
for changes in working capital in 2014, compared to 2013, was primarily due to an increase in cash
used for receivables and a decrease in cash provided by trade accounts payables, partially offset by an
increase in cash provided by accrued expenses.
Net cash used by investing activities
Cash used by investing activities was $3.6 billion in 2015, compared to $3.1 billion in 2014 and
$4.8 billion in 2013. The amount of cash used by investing activities increased in 2015, compared
to 2014, due to increased payments for capital investments, partially offset by lower payments for
mergers. The amount of cash used by investing activities decreased in 2014, compared to 2013, due to
decreased payments for mergers, offset primarily by increased payments for capital investments. Capital
investments, including payments for lease buyouts, but excluding mergers, were $3.3 billion in 2015,
$2.8 billion in 2014 and $2.3 billion in 2013. Merger payments were $168 million in 2015, $252 million in
2014 and $2.3 billion in 2013. Merger payments decreased in 2014, compared to 2013, primarily due to
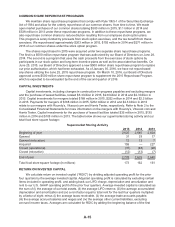
our merger with Harris Teeter in 2013. Refer to the “Capital Investments” section for an overview of our
supermarket storing activity during the last three years.
Net cash provided (used) by financing activities
Financing activities (used) provided cash of ($1.3) billion in 2015, ($1.2) billion in 2014 and $1.4
billion in 2013. The increase in the amount of cash used for financing activities in 2015, compared to
2014, was primarily related to increased payments on long-term debt and commercial paper, partially
offset by higher proceeds from issuances of long-term debt and decreased treasury stock purchases.
The increase in the amount of cash used for financing activities in 2014, compared to 2013, was primarily
related to decreased proceeds from the issuance of long-term debt and increased treasury stock
purchases, offset partially by decreased payments on long-term debt. Proceeds from the issuance of
long-term debt were $1.2 billion in 2015, $576 million in 2014 and $3.5 billion in 2013. Net (payments)
borrowings provided from our commercial paper program were ($285) million in 2015, $25 million in
2014 and ($395) million in 2013. Please refer to the “Debt Management” section of MD&A for additional
information. We repurchased $703 million of Kroger common shares in 2015, compared to $1.3 billion in
2014 and $609 million in 2013. We paid dividends totaling $385 million in 2015, $338 million in 2014 and
$319 million in 2013.
Debt Management
Total debt, including both the current and long-term portions of capital lease and lease-financing
obligations, increased $481 million to $12.1 billion as of year-end 2015, compared to 2014. The increase
in 2015, compared to 2014, resulted primarily from the issuance of (i) $300 million of senior notes bearing
an interest rate of 2.00%, (ii) $300 million of senior notes bearing an interest rate of 2.60%, (iii) $500
million of senior notes bearing an interest rate of 3.50% and (iv) an increase in capital lease obligations
due to our merger with Roundy’s and various leased locations, partially offset by payments of $678
million on long-term debt obligations assumed as part of our merger with Roundy’s and $500 million
of payments at maturity of senior notes bearing an interest rate of 3.90%. The increase in financing
obligations was due to partially funding our merger with Roundy’s.