Kroger 2015 Annual Report Download - page 116
Download and view the complete annual report
Please find page 116 of the 2015 Kroger annual report below. You can navigate through the pages in the report by either clicking on the pages listed below, or by using the keyword search tool below to find specific information within the annual report.-
 1
1 -
2
-
3
-
4
-
5
-
6
-
7
-
8
-
9
-
10
-
11
-
12
-
13
-
14
-
15
-
16
-
17
-
18
-
19
-
20
-
21
-
22
-
23
-
24
-
25
-
26
-
27
-
28
-
29
-
30
-
31
-
32
-
33
-
34
-
35
-
36
-
37
-
38
-
39
-
40
-
41
-
42
-
43
-
44
-
45
-
46
-
47
-
48
-
49
-
50
-
51
-
52
-
53
-
54
-
55
-
56
-
57
-
58
-
59
-
60
-
61
-
62
-
63
-
64
-
65
-
66
-
67
-
68
-
69
-
70
-
71
-
72
-
73
-
74
-
75
-
76
-
77
-
78
-
79
-
80
-
81
-
82
-
83
-
84
-
85
-
86
-
87
-
88
-
89
-
90
-
91
-
92
-
93
-
94
-
95
-
96
-
97
-
98
-
99
-
100
-
101
-
102
-
103
-
104
-
105
-
 106
106 -
 107
107 -
 108
108 -
 109
109 -
 110
110 -
 111
111 -
 112
112 -
 113
113 -
 114
114 -
 115
115 -
 116
116 -
 117
117 -
 118
118 -
 119
119 -
 120
120 -
 121
121 -
 122
122 -
 123
123 -
 124
124 -
 125
125 -
 126
126 -
127
-
128
-
129
-
130
-
131
-
132
-
133
-
134
-
135
-
136
-
137
-
138
-
139
-
140
-
141
-
142
-
143
-
144
-
145
-
146
-
147
-
148
-
149
-
150
-
151
-
152
-
153
 |
 |

A-42
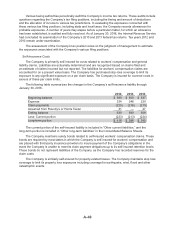
Segments
The Company operates retail food and drug stores, multi-department stores, jewelry stores, and
convenience stores throughout the United States. The Company’s retail operations, which represent
over 99% of the Company’s consolidated sales and EBITDA, are its only reportable segment. The
Company’s retail operating divisions have been aggregated into one reportable segment due to the
operating divisions having similar economic characteristics with similar long-term financial performance.
In addition, the Company’s operating divisions offer to its customers similar products, have similar
distribution methods, operate in similar regulatory environments, purchase the majority of the Company’s
merchandise for retail sale from similar (and in many cases identical) vendors on a coordinated basis
from a centralized location, serve similar types of customers, and are allocated capital from a centralized
location. The Company’s operating divisions reflect the manner in which the business is managed and
how the Company’s Chief Executive Officer, who acts as the Company’s chief operating decision maker,
assess performance internally. All of the Company’s operations are domestic.
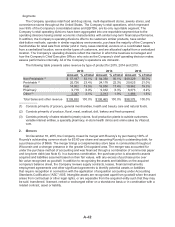
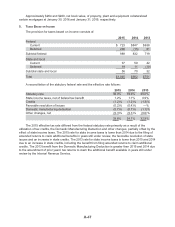
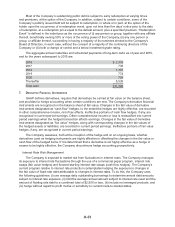
The following table presents sales revenue by type of product for 2015, 2014 and 2013.
2015 2014 2013
Amount % of total Amount % of total Amount % of total
Non Perishable (1) $ 57,187 52.1% $ 54,392 50.1% $49,229 50.0%
Perishable (2) 25,726 23.4% 24,178 22.3% 20,625 21.0%
Fuel 14,802 13.5% 18,850 17.4% 18,962 19.3%
Pharmacy 9,778 8.9% 9,032 8.3% 8,073 8.2%
Other (3) 2,337 2.1% 2,013 1.9% 1,486 1.5%
Total Sales and other revenue $109,830 100.0% $108,465 100.0% $98,375 100.0%
(1) Consists primarily of grocery, general merchandise, health and beauty care and natural foods.
(2) Consists primarily of produce, floral, meat, seafood, deli, bakery and fresh prepared.
(3) Consists primarily of sales related to jewelry stores, food production plants to outside customers,
variable interest entities, a specialty pharmacy, in-store health clinics and online sales by Vitacost.
com.
2. MERGERS
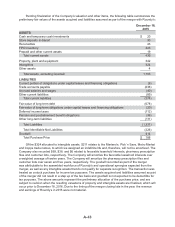
On December 18, 2015, the Company closed its merger with Roundy’s by purchasing 100% of
Roundy’s outstanding common stock for $3.60 per share and assuming Roundy’s outstanding debt, for
a purchase price of $866. The merger brings a complementary store base in communities throughout
Wisconsin and a stronger presence in the greater Chicagoland area. The merger was accounted for
under the purchase method of accounting and was financed through a combination of commercial paper
and long-term debt (see Note 6). In a business combination, the purchase price is allocated to assets
acquired and liabilities assumed based on their fair values, with any excess of purchase price over
fair value recognized as goodwill. In addition to recognizing the assets and liabilities on the acquired
company’s balance sheet, the Company reviews supply contracts, leases, financial instruments,
employment agreements and other significant agreements to identify potential assets or liabilities
that require recognition in connection with the application of acquisition accounting under Accounting
Standards Codification (“ASC”) 805. Intangible assets are recognized apart from goodwill when the asset
arises from contractual or other legal rights, or are separable from the acquired entity such that they may
be sold, transferred, licensed, rented or exchanged either on a standalone basis or in combination with a
related contract, asset or liability.