Kroger 2015 Annual Report Download - page 87
Download and view the complete annual report
Please find page 87 of the 2015 Kroger annual report below. You can navigate through the pages in the report by either clicking on the pages listed below, or by using the keyword search tool below to find specific information within the annual report.-
 1
1 -
2
-
3
-
4
-
5
-
6
-
7
-
8
-
9
-
10
-
11
-
12
-
13
-
14
-
15
-
16
-
17
-
18
-
19
-
20
-
21
-
22
-
23
-
24
-
25
-
26
-
27
-
28
-
29
-
30
-
31
-
32
-
33
-
34
-
35
-
36
-
37
-
38
-
39
-
40
-
41
-
42
-
43
-
44
-
45
-
46
-
47
-
48
-
49
-
50
-
51
-
52
-
53
-
54
-
55
-
56
-
57
-
58
-
59
-
60
-
61
-
62
-
63
-
64
-
65
-
66
-
67
-
68
-
69
-
70
-
71
-
72
-
73
-
74
-
75
-
76
-
 77
77 -
 78
78 -
 79
79 -
 80
80 -
 81
81 -
 82
82 -
 83
83 -
 84
84 -
 85
85 -
 86
86 -
 87
87 -
 88
88 -
 89
89 -
 90
90 -
 91
91 -
 92
92 -
 93
93 -
 94
94 -
 95
95 -
 96
96 -
 97
97 -
98
-
99
-
100
-
101
-
102
-
103
-
104
-
105
-
106
-
107
-
108
-
109
-
110
-
111
-
112
-
113
-
114
-
115
-
116
-
117
-
118
-
119
-
120
-
121
-
122
-
123
-
124
-
125
-
126
-
127
-
128
-
129
-
130
-
131
-
132
-
133
-
134
-
135
-
136
-
137
-
138
-
139
-
140
-
141
-
142
-
143
-
144
-
145
-
146
-
147
-
148
-
149
-
150
-
151
-
152
-
153
 |
 |
A-13
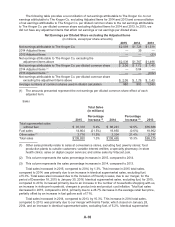
EMV chargebacks , company sponsored pension, healthcare and incentive plan costs, as a percentage
of sales. OG&A expenses, as a percentage of sales excluding fuel, the 2014 Contributions and the 2014
Multi-Employer Pension Plan Obligation, decreased 19 basis points in 2014, compared to 2013, adjusted
for the 2013 Adjusted Items. The decrease in our adjusted OG&A rate in 2014, compared to 2013,
resulted primarily from increased supermarket sales growth, productivity improvements and effective cost
controls at the store level, offset partially by the effect of our merger with Harris Teeter and increases in
credit card fees and incentive plan costs, as a percentage of sales.
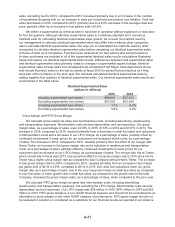
Rent Expense
Rent expense was $723 million in 2015, compared to $707 million in 2014 and $613 million in 2013.
Rent expense, as a percentage of sales, was 0.66% in 2015, compared to 0.65% in 2014 and 0.62% in
2013. Rent expense increased in 2015, compared to 2014, due to the effect of our merger with Roundy’s,
partially offset by our continued emphasis on owning rather than leasing, whenever possible. Rent
expense, as a percentage of sales, in 2015 was consistent with 2014 due to the effect of our merger
with Roundy’s, partially offset by our continued emphasis to own rather than lease, whenever possible,
and the benefit of increased sales. The increase in rent expense, as a percentage of sales, in 2014,
compared to 2013, is due to the effect of our merger with Harris Teeter, partially offset by our continued
emphasis to own rather than lease, whenever possible, and the benefit of increased sales. The merger
with Harris Teeter, which closed late in fiscal year 2013, increased rent expense, as a percentage of
sales, since Harris Teeter has a higher rent expense rate compared to the total Company without Harris
Teeter.
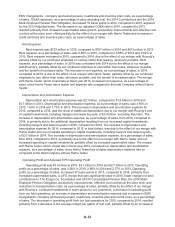
Depreciation and Amortization Expense
Depreciation and amortization expense was $2.1 billion, compared to $1.9 billion in 2014 and
$1.7 billion in 2013. Depreciation and amortization expense, as a percentage of sales, was 1.90% in
2015, 1.80% in 2014 and 1.73% in 2013. The increase in depreciation and amortization expense for
2015, compared to 2014, was the result of additional depreciation due to our merger with Roundy’s and
on capital investments, including mergers and lease buyouts, of $3.4 billion, excluding Roundy’s. The
increase in depreciation and amortization expense, as a percentage of sales, from 2015, compared to
2014, is primarily due to the additional depreciation resulting from our increased capital investments,
including mergers and lease buyouts in 2015, compared to 2014. The increase in depreciation and
amortization expense for 2014, compared to 2013, in total dollars, was due to the effect of our merger with
Harris Teeter and our increased spending in capital investments, including mergers and lease buyouts,
of $3.1 billion in 2014. The increase in depreciation and amortization expense, as a percentage of sales,
from 2014, compared to 2013, is primarily due to the effect of our merger with Harris Teeter and our
increased spending in capital investments, partially offset by increased supermarket sales. The merger
with Harris Teeter, which closed late in fiscal year 2013, increased our depreciation and amortization
expense, as a percentage of sales, since Harris Teeter has a higher depreciation expense rate as
compared to the total Company without Harris Teeter.
Operating Profit and Adjusted FIFO Operating Profit
Operating profit was $3.6 billion in 2015, $3.1 billion in 2014 and $2.7 billion in 2013. Operating
profit, as a percentage of sales, was 3.26% in 2015, 2.89% in 2014 and 2.77% in 2013. Operating
profit, as a percentage of sales, increased 37 basis points in 2015, compared to 2014, primarily from
increased supermarket sales, a LIFO charge that was significantly lower in 2015, lower charges for total
contributions to The Kroger Co. Foundation and UFCW Consolidated Pension Plan, the 2014 Multi-
Employer Pension Obligation, productivity improvements, effective cost controls at the store level, and
reductions in transportation costs, as a percentage of sales, partially offset by the effect of our merger
with Roundy’s, continued investments in lower prices for our customers, a decrease in operating profit
from our fuel operations, an increase in depreciation and amortization expense and increases in EMV
chargebacks, company sponsored pension, healthcare, incentive plan and shrink costs, as a percentage
of sales. The decrease in operating profit from our fuel operations for 2015, compared to 2014, resulted
primarily from a decrease in the average margin per gallon of fuel sold, partially offset by an increase in