Kroger 2015 Annual Report Download - page 50
Download and view the complete annual report
Please find page 50 of the 2015 Kroger annual report below. You can navigate through the pages in the report by either clicking on the pages listed below, or by using the keyword search tool below to find specific information within the annual report.-
 1
1 -
2
-
3
-
4
-
5
-
6
-
7
-
8
-
9
-
10
-
11
-
12
-
13
-
14
-
15
-
16
-
17
-
18
-
19
-
20
-
21
-
22
-
23
-
24
-
25
-
26
-
27
-
28
-
29
-
30
-
31
-
32
-
33
-
34
-
35
-
36
-
37
-
38
-
39
-
 40
40 -
 41
41 -
 42
42 -
 43
43 -
 44
44 -
 45
45 -
 46
46 -
 47
47 -
 48
48 -
 49
49 -
 50
50 -
 51
51 -
 52
52 -
 53
53 -
 54
54 -
 55
55 -
 56
56 -
 57
57 -
 58
58 -
 59
59 -
 60
60 -
61
-
62
-
63
-
64
-
65
-
66
-
67
-
68
-
69
-
70
-
71
-
72
-
73
-
74
-
75
-
76
-
77
-
78
-
79
-
80
-
81
-
82
-
83
-
84
-
85
-
86
-
87
-
88
-
89
-
90
-
91
-
92
-
93
-
94
-
95
-
96
-
97
-
98
-
99
-
100
-
101
-
102
-
103
-
104
-
105
-
106
-
107
-
108
-
109
-
110
-
111
-
112
-
113
-
114
-
115
-
116
-
117
-
118
-
119
-
120
-
121
-
122
-
123
-
124
-
125
-
126
-
127
-
128
-
129
-
130
-
131
-
132
-
133
-
134
-
135
-
136
-
137
-
138
-
139
-
140
-
141
-
142
-
143
-
144
-
145
-
146
-
147
-
148
-
149
-
150
-
151
-
152
-
153
 |
 |

48
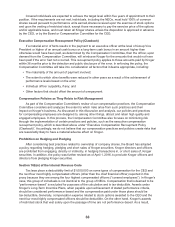
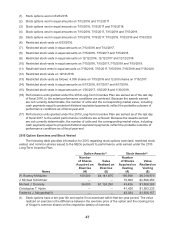
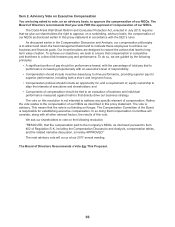
(2) The Stock Awards columns include vested restricted stock and earned performance units, as
follows:
Vested Restricted Stock Earned Performance Units
Name
Number of
Shares
Value
Realized
Number of
Shares
Value
Realized
Mr. McMullen 107,948 $4,181,764 48,720 $1,838,206
Mr. Schlotman 43,488 $1,665,496 27,320 $1,030,784
Mr. Donnelly 30,746 $1,189,872 12,680 $ 478,416
Mr. Hjelm 28,746 $ 1,114,817 12,680 $ 478,416
Mr. Morganthall 33,934 $1,312,814 9,100 $ 343,343
Restricted stock. The table includes the number of shares acquired upon vesting of restricted stock
and the value realized on the vesting of restricted stock.
Performance Units. In 2013, participants in the 2013 Long-Term Incentive Plan were awarded
performance units that were earned based on performance criteria established by the Compensation
Committee at the beginning of the three-year performance period. Actual payouts were based on the
level of performance achieved, and were paid in common shares. The number of common shares
issued and the value realized based on the closing price of Kroger common shares of $37.73 on
March 10, 2016, the date of deemed delivery of the shares, are reflected in the table above.
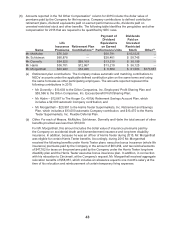
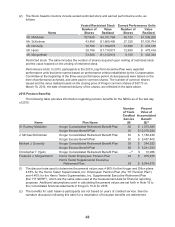
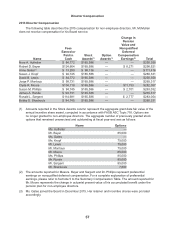
2015 Pension Benefits
The following table provides information regarding pension benefits for the NEOs as of the last day
of 2015.
Name Plan Name
Number
of Years
Credited
Service
(#)
Present
Value of
Accumulated
Benefit
($)(1)
W. Rodney McMullen Kroger Consolidated Retirement Benefit Plan 30 $ 1,070,880
Kroger Excess Benefit Plan 30 $10,276,024
J. Michael Schlotman Kroger Consolidated Retirement Benefit Plan 30 $ 1,169,438
Kroger Excess Benefit Plan 30 $ 5,457,400
Michael J. Donnelly Kroger Consolidated Retirement Benefit Plan 36 $ 244,532
Kroger Excess Benefit Plan 36 $ 3,241,033
Christopher T. Hjelm Kroger Consolidated Retirement Benefit Plan —(2) $ 10,086
Frederick J. Morganthall II Harris Teeter Employees’ Pension Plan 29 $ 975,455
Harris Teeter Supplemental Executive
Retirement Plan 29 $ 8,044,875
(1) The discount rate used to determine the present values was 4.66% for the Kroger and Dillon plans,
4.65% for the Harris Teeter Supermarkets, Inc. Employees’ Pension Plan (the “HT Pension Plan”)
and 4.40% for the Harris Teeter Supermarkets, Inc. Supplemental Executive Retirement Plan
(the “HT SERP”), which are the same rates used at the measurement date for financial reporting
purposes. Additional assumptions used in calculating the present values are set forth in Note 15 to
the consolidated financial statements in Kroger’s 10-K for 2015.
(2) The benefits for cash balance participants are not based on years of credited service. See the
narrative discussion following this table for a description of how plan benefits are determined.