IBM 2006 Annual Report Download - page 9
Download and view the complete annual report
Please find page 9 of the 2006 IBM annual report below. You can navigate through the pages in the report by either clicking on the pages listed below, or by using the keyword search tool below to find specific information within the annual report.-
 1
1 -
 2
2 -
 3
3 -
 4
4 -
 5
5 -
 6
6 -
 7
7 -
 8
8 -
 9
9 -
 10
10 -
 11
11 -
 12
12 -
 13
13 -
 14
14 -
 15
15 -
 16
16 -
 17
17 -
 18
18 -
 19
19 -
 20
20 -
21
-
22
-
23
-
24
-
25
-
26
-
27
-
28
-
29
-
30
-
31
-
32
-
33
-
34
-
35
-
36
-
37
-
38
-
39
-
40
-
41
-
42
-
43
-
44
-
45
-
46
-
47
-
48
-
49
-
50
-
51
-
52
-
53
-
54
-
55
-
56
-
57
-
58
-
59
-
60
-
61
-
62
-
63
-
64
-
65
-
66
-
67
-
68
-
69
-
70
-
71
-
72
-
73
-
74
-
75
-
76
-
77
-
78
-
79
-
80
-
81
-
82
-
83
-
84
-
85
-
86
-
87
-
88
-
89
-
90
-
91
-
92
-
93
-
94
-
95
-
96
-
97
-
98
-
99
-
100
-
101
-
102
-
103
-
104
-
105
-
106
-
107
-
108
-
109
-
110
-
111
-
112
-
113
-
114
-
115
-
116
-
117
-
118
-
119
-
120
-
121
-
122
-
123
-
124
 |
 |

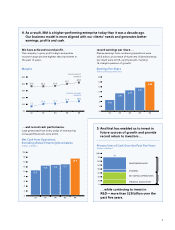
7
0
2.43
02
3.76
03
4.39
04
4.91
05
6.06
06
1
2
3
4
5
6
$7
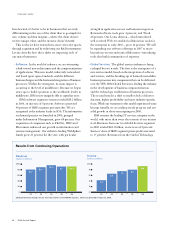
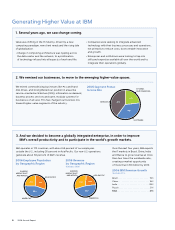
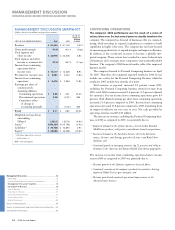
4. As a result, IBM is a higher-performing enterprise today than it was a decade ago.
Our business model is more aligned with our clients’ needs and generates better
earnings, profits and cash.
record earnings per share . . .
Pretax earnings from continuing operations were
$13.3 billion, an increase of 9 percent. Diluted earnings
per share were $6.06, up 23 percent, marking
16 straight quarters of growth.
41.9
40.1
36.9
36.5
36.6
0605040302
14.6
13.4
11.1
10.6
7.2
0%
40%
50%
10%
20%
30%
10.5
02
6
8
2
4
10
12
14
16
$18
0
12.6
03
12.9
04
13.1
05
15.3
06
We have achieved record profit . . .
The company’s gross profit margin and pretax
income margin are the highest they have been in
the past years.
. . . and record cash performance.
Cash generated from every dollar of revenue has
increased 18 percent since 2003.
Earnings Per Share
(From continuing operations)
Margins
Net Cash from Operations,
Excluding Global Financing Receivables
(Dollars in billions)
GROSS PROFIT
MARGIN
PRETAX INCOME
MARGIN
5. And that has enabled us to invest in
future sources of growth and provide
record return to investors . . .
Returned to Shareholders Reinvested
$80
70
60
50
40
30
20
10
0
SHARE REPURCHASES
DIVIDENDS
NET CAPITAL EXPENDITURES
STRATEGIC ACQUISITIONS
70
Primary Uses of Cash Over the Past Five Years
(Dollars in billions)
. . . while continuing to invest in
R&D — more than $28 billion over the
past five years.
cyan mag yelo black
MAC
2718