IBM 2006 Annual Report Download - page 27
Download and view the complete annual report
Please find page 27 of the 2006 IBM annual report below. You can navigate through the pages in the report by either clicking on the pages listed below, or by using the keyword search tool below to find specific information within the annual report.-
 1
1 -
2
-
3
-
4
-
5
-
6
-
7
-
8
-
9
-
10
-
11
-
12
-
13
-
14
-
15
-
16
-
 17
17 -
 18
18 -
 19
19 -
 20
20 -
 21
21 -
 22
22 -
 23
23 -
 24
24 -
 25
25 -
 26
26 -
 27
27 -
 28
28 -
 29
29 -
 30
30 -
 31
31 -
 32
32 -
 33
33 -
 34
34 -
 35
35 -
 36
36 -
 37
37 -
38
-
39
-
40
-
41
-
42
-
43
-
44
-
45
-
46
-
47
-
48
-
49
-
50
-
51
-
52
-
53
-
54
-
55
-
56
-
57
-
58
-
59
-
60
-
61
-
62
-
63
-
64
-
65
-
66
-
67
-
68
-
69
-
70
-
71
-
72
-
73
-
74
-
75
-
76
-
77
-
78
-
79
-
80
-
81
-
82
-
83
-
84
-
85
-
86
-
87
-
88
-
89
-
90
-
91
-
92
-
93
-
94
-
95
-
96
-
97
-
98
-
99
-
100
-
101
-
102
-
103
-
104
-
105
-
106
-
107
-
108
-
109
-
110
-
111
-
112
-
113
-
114
-
115
-
116
-
117
-
118
-
119
-
120
-
121
-
122
-
123
-
124
 |
 |

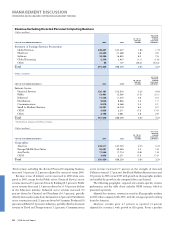
perspective, the increased revenue was driven by software. Latin
America led the regions with growth of 14.4 percent (9 percent
adjusted for currency). Brazil grew 18.9 percent (8 percent adjusted
for currency). The U.S. increased 3.6 percent and Canada grew 6.5
percent (flat adjusted for currency).
EMEA revenue increased 3.2 percent (2 percent adjusted for cur-
rency) in 2006 when compared with 2005, with revenue growth in all
the major countries, except Germany. Revenue increased in the U.K.
3.0 percent (1 percent adjusted for currency), France 4.0 percent (2
percent adjusted for currency), Spain 4.1 percent (2 percent adjusted
for currency) and Italy 3.6 percent (2 percent adjusted for currency).
Germany declined a modest 0.3 percent as reported (2 percent
adjusted for currency) in 2006 when compared to 2005. Russia grew
21.1 percent (21 percent adjusted for currency).
Asia Pacific revenue declined 0.8 percent (increased 2 percent
adjusted for currency) in 2006 versus the prior year. Although Japan
revenue declined 7.5 percent (2 percent adjusted for currency), its
performance improved sequentially throughout 2006 and returned to
growth in the fourth quarter. Partially offsetting the revenue decline
in Japan was growth in other Asia Pacific regions. China grew 15.8
percent (14 percent adjusted for currency), Korea grew 14.2 percent
(6 percent adjusted for currency) and India increased 38.5 percent (42
percent adjusted for currency).
For the year, the company benefited from solid contributions from
the emerging countries of Brazil, India, Russia and China . Collectively,
revenue from these four countries increased 20.5 percent (16 percent
adjusted for currency) in 2006 versus 2005.
OEM revenue increased 17.9 percent (18 percent adjusted for cur-
rency) in 2006 versus 2005 driven by strong game processor demand
in the Microelectronics business.
Total Global Services revenue increased 1.8 percent in 2006 versus
2005. The increase was driven by GTS (2.4 percent) and GBS (0.4
percent). The increase in GTS was driven by Strategic Outsourcing
(3.2 percent) and BTO (17.2 percent), partially offset by a decline in
ITS revenue of 1.8 percent.
Overall, Hardware revenue declined as reported in 2006 compared
to 2005 due to the divestiture of the Personal Computing business.
Systems and Technology Group revenue increased 4.7 percent as
System z revenue increased 7.8 percent and MIPS (millions of instruc-
tions per second) volumes increased 11 percent versus 2005. System
Storage revenue increased 6.4 percent as Total disk grew 7.8 percent
driven by midrange disk (16.5 percent), while tape products revenue
increased 3.1 percent. Microelectronics revenue increased 21.9 per-
cent driven by strong demand in games processors and networking
components. System x increased 3.7 percent compared to 2005 driven
by increased revenue for servers (5.3 percent) and Blades (22.3 per-
cent). Retail Stores Solutions revenue increased 21.4 percent versus
2005. These increases were partially offset by declines in System i
servers (15.0) percent, System p servers (1.1 percent), Printing
Systems (7.6 percent) and E&TS (16.2 percent).
Personal Computing Division had no revenue in 2006 versus four
months of revenue in 2005. See note C, “Acquisitions/Divestitures,”
on pages 77 and 78 for additional information.
MANAGEMENT DISCUSSION
INTERNATIONAL BUSINESS MACHIN ES CORPORATION AND SUBSI DIARY COMPANIES
25
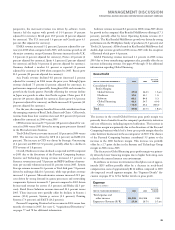
Software revenue increased 8.2 percent in 2006 versus 2005 driven
by growth in the company’s Key Branded Middleware offerings (17.1
percent), partially offset by lower Operating Systems revenue (6.3
percent). The Key Branded Middleware growth was driven by strong
performance in the WebSphere family of products (23.3 percent) and
Tivoli (26.3 percent). All five brands in Key Branded Middleware had
double-digit revenue growth in 2006 versus 2005 with the exception
of Rational which grew 4.4 percent.
Global Financing revenue decreased 1.1 percent in 2006 versus
2005 due to lower remarketing equipment sales, partially offset by an
increase in financing revenue. See pages 49 through 53 for additional
information regarding Global Financing.
Gross Profit
YR. TO YR.
FOR THE YEAR ENDED DECEMBER 31: 2006 2005 CHANGE
Consolidated Gross
Profit Margins:
Global Services .% .% . pts.
Hardware . . .
Software . . .
Global Financing . . (.)
Other (.) . (.)
Total .% .% . pts.
The increase in the overall Global Services gross profit margin was
primarily due to benefits from the company’s productivity initiatives
and cost efficiencies, including improved utilization. The increase in
Hardware margin was primarily due to the divestiture of the Personal
Computing business (which had a lower gross profit margin than the
other hardware businesses) in the second quarter of 2005. The absence
of the Personal Computing business contributed 3.5 points to the
increase in the 2006 hardware margin. This increase was partially
offset by a 2.7 point decline in the Systems and Technology Group
margin in 2006 versus 2005.
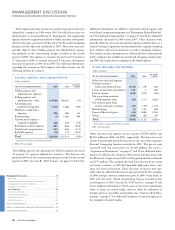
The decrease in Global Financing gross profit margin was primar-
ily driven by lower financing margins due to higher borrowing costs
related to the external interest rate environment.
In addition, an increase in retirement-related plan costs of approx-
imately $235 million partially offset by a decrease in stock-based
compensation costs of approximately $114 million compared to 2005
also impacted overall segment margins. See “Segment Details” dis-
cussion on pages 29 to 32 for further details on gross profit.
Expense
(Dollars in millions)
YR. TO YR.
FOR THE YEAR ENDED DECEMBER 31: 2006 2005 CHANGE
Total expense and
other income $, $, .%
Expense to Revenue (E/R) .% .% . pts.
Black
MAC
2718 CG10