IBM 2006 Annual Report Download - page 36
Download and view the complete annual report
Please find page 36 of the 2006 IBM annual report below. You can navigate through the pages in the report by either clicking on the pages listed below, or by using the keyword search tool below to find specific information within the annual report.-
 1
1 -
2
-
3
-
4
-
5
-
6
-
7
-
8
-
9
-
10
-
11
-
12
-
13
-
14
-
15
-
16
-
17
-
18
-
19
-
20
-
21
-
22
-
23
-
24
-
25
-
 26
26 -
 27
27 -
 28
28 -
 29
29 -
 30
30 -
 31
31 -
 32
32 -
 33
33 -
 34
34 -
 35
35 -
 36
36 -
 37
37 -
 38
38 -
 39
39 -
 40
40 -
 41
41 -
 42
42 -
 43
43 -
 44
44 -
 45
45 -
 46
46 -
47
-
48
-
49
-
50
-
51
-
52
-
53
-
54
-
55
-
56
-
57
-
58
-
59
-
60
-
61
-
62
-
63
-
64
-
65
-
66
-
67
-
68
-
69
-
70
-
71
-
72
-
73
-
74
-
75
-
76
-
77
-
78
-
79
-
80
-
81
-
82
-
83
-
84
-
85
-
86
-
87
-
88
-
89
-
90
-
91
-
92
-
93
-
94
-
95
-
96
-
97
-
98
-
99
-
100
-
101
-
102
-
103
-
104
-
105
-
106
-
107
-
108
-
109
-
110
-
111
-
112
-
113
-
114
-
115
-
116
-
117
-
118
-
119
-
120
-
121
-
122
-
123
-
124
 |
 |

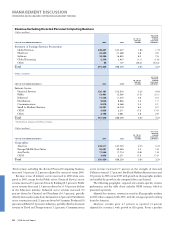
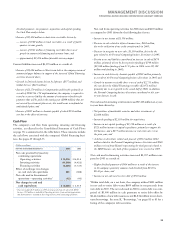
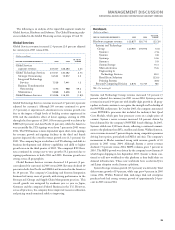
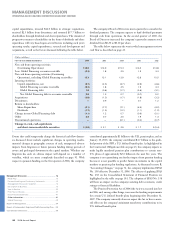
Non-Current Assets and Liabilities
(Dollars in millions)
AT DECEMBER 31: 2006 2005
Non-current assets $, $,
Long-term debt $, $,
Non-current liabilities (excluding debt) $, $,
The decrease in Non-current assets of $1,513 million compared to
the prior year-end balance was primarily driven by:
• A decline of $9,996 million ($10,776 million excluding the effects of
currency) in Prepaid pension assets primarily attributable to the imple-
mentation of SFAS No. 158 which requires that only overfunded plans
( fair value of plan assets exceed the benefit obligation) be recognized
as a Prepaid pension asset for the excess amount.
The significant decline in Prepaid pension assets was offset by increases
in other non-current asset categories as follows:
• Increase in Goodwill of $3,413 million and $539 million in Intangible
assets-net, both driven by the company’s acquisitions in the current year;
• Growth of $440 million in long-term financing receivables due to
increased Global Financing volumes;
• Increase of $3,408 million in Investments and sundry assets which
was attributable to three key factors:
— increase of $2,048 million in non-current deferred tax assets
primarily as a result of SFAS No. 158;
— growth of $451 million in deferred transition costs driven by
an increase in long-term services arrangements with clients; and
— $345 million due to increased investments in long-term
marketable securities.
Long-term debt decreased $1,644 million primarily due to a reclas-
sification to short-term debt as these items approach maturity. The
company continually monitors its liquidity profile and interest rates,
and manages its short- and long-term debt portfolios accordingly.
Other non-current liabilities, excluding debt, decreased $1,216
million due to decreases of $951 million ($1,145 million before the
effects of currency) in non-current deferred tax liabilities and $226
million ($858 million before the effects of currency) in Retirement
and nonpension postretirement benefit obligations primarily due to
the implementation of SFAS No. 158.
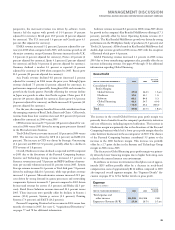
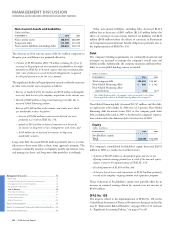
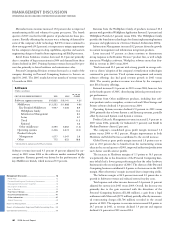
Debt
The company’s funding requirements are continually monitored and
strategies are executed to manage the company’s overall asset and
liability profile. Additionally, the company maintains sufficient flexi-
bility to access global funding sources as needed.
(Dollars in millions)
AT DECEMBER 31: 2006 2005
Total company debt $, $,
Non-Global Financing debt* $ $ ,
Non-Global Financing debt/
capitalization .% .%
* Non-Global Financing debt is the company’s total external debt less the Global
Financing debt described in the Global Financing balance sheet on page 50.
Non-Global Financing debt decreased $1,747 million and the debt-
to-capital ratio at December 31, 2006 was at 1.5 percent. Non-Global
Financing debt decreased versus 2005 as the company paid down
debt, including debt used in 2005 to facilitate the company’s repatria-
tion actions under the American Jobs Creation Act of 2004.
Equity
(Dollars in millions)
AT DECEMBER 31: 2006 2005
Stockholders’ equity:
Total $, $,
The company’s consolidated Stockholders’ equity decreased $4,592
million in 2006 as a result of several key factors:
• A decline of $6,885 million in Accumulated gains and (losses) not
affecting retained earnings primarily as a result of the non-cash equity
impacts related to the implementation of SFAS No. 158;
• Dividend payments of $1,683 million; and
• A decrease driven by net stock transactions of $5,405 million, primarily
a result of the company’s ongoing common stock repurchase program.
These reductions in Stockholders’ equity were partially offset by an
increase in retained earnings driven by current year net income of
$9,492 million.
SFAS No. 158
The impacts related to the implementation of SFAS No. 158 on the
Consolidated Statement of Financial Position are discussed in detail in
note V, “Retirement-Related Benefits,” on pages 100 to 111 and note
A, “Significant Accounting Policies,” on pages 67 to 68.
MANAGEMENT DISCUSSION
INTERNATIONAL BUSINESS MACHINES CORPORATION AND SUBSIDIARY COMPANIES
34 2006 Annual Report
Management Discussion ........................................................
Road Map .............................................................................
Forward-Looking and Cautionary Statements .....................
Management Discussion Snapshot ......................................
Description of Business .......................................................
Year in Review......................................................................
Prior Year in Review .............................................................
Discontinued Operations .....................................................
Other Information ................................................................
Global Financing ..................................................................
Report of Management .........................................................
Report of Independent Registered Public Accounting Firm ....
Consolidated Statements .......................................................
Black
MAC
2718 CG10