IBM 2006 Annual Report Download - page 115
Download and view the complete annual report
Please find page 115 of the 2006 IBM annual report below. You can navigate through the pages in the report by either clicking on the pages listed below, or by using the keyword search tool below to find specific information within the annual report.-
 1
1 -
2
-
3
-
4
-
5
-
6
-
7
-
8
-
9
-
10
-
11
-
12
-
13
-
14
-
15
-
16
-
17
-
18
-
19
-
20
-
21
-
22
-
23
-
24
-
25
-
26
-
27
-
28
-
29
-
30
-
31
-
32
-
33
-
34
-
35
-
36
-
37
-
38
-
39
-
40
-
41
-
42
-
43
-
44
-
45
-
46
-
47
-
48
-
49
-
50
-
51
-
52
-
53
-
54
-
55
-
56
-
57
-
58
-
59
-
60
-
61
-
62
-
63
-
64
-
65
-
66
-
67
-
68
-
69
-
70
-
71
-
72
-
73
-
74
-
75
-
76
-
77
-
78
-
79
-
80
-
81
-
82
-
83
-
84
-
85
-
86
-
87
-
88
-
89
-
90
-
91
-
92
-
93
-
94
-
95
-
96
-
97
-
98
-
99
-
100
-
101
-
102
-
103
-
104
-
 105
105 -
 106
106 -
 107
107 -
 108
108 -
 109
109 -
 110
110 -
 111
111 -
 112
112 -
 113
113 -
 114
114 -
 115
115 -
 116
116 -
 117
117 -
 118
118 -
 119
119 -
 120
120 -
 121
121 -
 122
122 -
 123
123 -
 124
124
 |
 |

Black
MAC
390 CG10
NOTES TO CONSOLIDATED FINANCIAL STATEMENTS
INTERNATIONAL BUSINESS MACHINES CORPORATION AND SUBSIDIARY COMPANIES
113
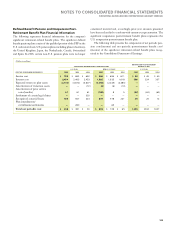
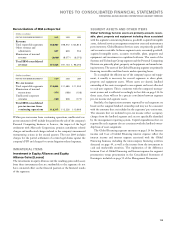
Reconciliations of IBM as Reported
(Dollars in millions)
FOR THE YEAR ENDED DECEMBER 31: 2006 2005 2004
Revenue:
Total reportable segments $, $, $,
Other revenue and
adjustments
Elimination of internal
revenue (,) (,) (,)
Total IBM consolidated
revenue $, $, $ ,
(Dollars in millions)
FOR THE YEAR ENDED DECEMBER 31: 2006 2005 2004
Pre-tax income:
Total reportable segments $, $, $ ,
Elimination of internal
transactions () () ()
Unallocated corporate
amounts () ()
Total IBM consolidated
pre-tax income from
continuing operations $, $, $ ,
Within pre-tax income from continuing operations, unallocated cor-
porate amounts in 2005 include the gain from the sale of the company’s
Personal Computing business to Lenovo, the impact of the legal
settlement with Microsoft Corporation, pension curtailment related
charges and unallocated charges related to the company’s incremental
restructuring actions in the second quarter. The year 2004 includes
charges for the partial settlement of certain legal claims against the
company’s PPP and charges for certain litigation-related expenses.
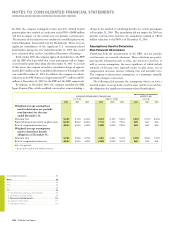
IMMATERIAL ITEMS
Investment in Equity Alliances and Equity
Alliance Gains/(Losses)
The investments in equity alliances and the resulting gains and (losses)
from these investments that are attributable to the segments do not
have a material effect on the financial position or the financial results
of the segments.
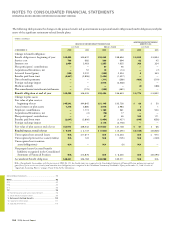
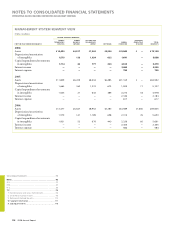
SEGMENT ASSETS AND OTHER ITEMS
Global Technology Services assets are primarily accounts receiv-
able, plant, property and equipment including those associated
with the segment’s outsourcing business, goodwill, acquired intangible
assets, deferred services arrangement transition costs and maintenance
parts inventory. Global Business Services assets are primarily goodwill
and accounts receivable. Software segment assets are mainly goodwill,
acquired intangible assets, accounts receivable, plant, property and
equipment and investment in capitalized software. The assets of the
Systems and Technology Group segment and the Personal Computing
Division are primarily plant, property and equipment and manufactur-
ing inventory. The assets of the Global Financing segment are primarily
financing receivables and fixed assets under operating leases.
To accomplish the efficient use of the company’s space and equip-
ment, it usually is necessary for several segments to share plant,
property and equipment assets. Where assets are shared, landlord
ownership of the assets is assigned to one segment and is not allocated
to each user segment. This is consistent with the company’s manage-
ment system and is reflected accordingly in the table on page 114. In
those cases, there will not be a precise correlation between segment
pre-tax income and segment assets.
Similarly, the depreciation amounts reported by each segment are
based on the assigned landlord ownership and may not be consistent
with the amounts that are included in the segments’ pre-tax income.
The amounts that are included in pre-tax income reflect occupancy
charges from the landlord segment and are not specifically identified
by the management reporting system. Capital expenditures that are
reported by each segment also are consistent with the landlord owner-
ship basis of asset assignment.
The Global Financing segment amounts on page 114 for Interest
income and Cost of Global Financing interest expense reflect the
interest income and interest expense associated with the Global
Financing business, including the intercompany financing activities
discussed on page 49, as well as the income from the investment in
cash and marketable securities. The explanation of the difference
between Cost of Global Financing and Interest expense for segment
presentation versus presentation in the Consolidated Statement of
Earnings is included on page 52 of the Management Discussion.