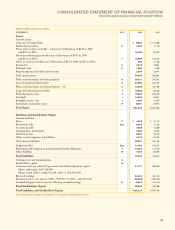
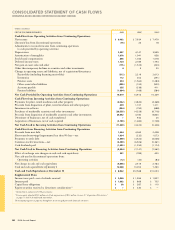
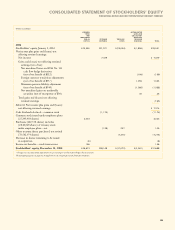
IBM 2006 Annual Report Download - page 51
Download and view the complete annual report
Please find page 51 of the 2006 IBM annual report below. You can navigate through the pages in the report by either clicking on the pages listed below, or by using the keyword search tool below to find specific information within the annual report.-
 1
1 -
2
-
3
-
4
-
5
-
6
-
7
-
8
-
9
-
10
-
11
-
12
-
13
-
14
-
15
-
16
-
17
-
18
-
19
-
20
-
21
-
22
-
23
-
24
-
25
-
26
-
27
-
28
-
29
-
30
-
31
-
32
-
33
-
34
-
35
-
36
-
37
-
38
-
39
-
40
-
 41
41 -
 42
42 -
 43
43 -
 44
44 -
 45
45 -
 46
46 -
 47
47 -
 48
48 -
 49
49 -
 50
50 -
 51
51 -
 52
52 -
 53
53 -
 54
54 -
 55
55 -
 56
56 -
 57
57 -
 58
58 -
 59
59 -
 60
60 -
 61
61 -
62
-
63
-
64
-
65
-
66
-
67
-
68
-
69
-
70
-
71
-
72
-
73
-
74
-
75
-
76
-
77
-
78
-
79
-
80
-
81
-
82
-
83
-
84
-
85
-
86
-
87
-
88
-
89
-
90
-
91
-
92
-
93
-
94
-
95
-
96
-
97
-
98
-
99
-
100
-
101
-
102
-
103
-
104
-
105
-
106
-
107
-
108
-
109
-
110
-
111
-
112
-
113
-
114
-
115
-
116
-
117
-
118
-
119
-
120
-
121
-
122
-
123
-
124
 |
 |

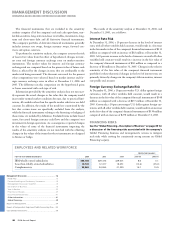
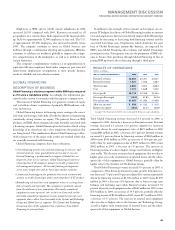
Employees at IBM and its wholly owned subsidiaries in 2006
increased 26,393 compared with 2005. Resources increased in all
geographies; on a country-basis, India experienced the largest growth,
up 16,024 to approximately 52,000 employees at year end. The U.S.
at approximately 127,000 employees, also increased modestly versus
2005. The company continues to invest in Global Services and
Software through a combination of hiring and acquisitions. IBM also
continues to rebalance its workforce globally to improve the compa-
ny’s competitiveness in the marketplace, as well as to withdraw from
certain businesses.
The company’s complementary workforce is an approximation of
equivalent full-time employees hired under temporary, part-time and
limited-term employment arrangements to meet specific business
needs in a flexible and cost-effective manner.
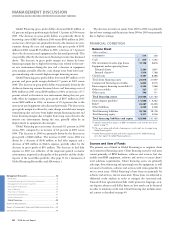
GLOBAL FINANCING
DESCRIPTION OF BUSINESS
Global Financing is a business segment within IBM that is measured
as if it were a standalone entity. Accordingly, the information pre-
sented in this section is consistent with this separate company view.
The mission of Global Financing is to generate a return on equity
and to facilitate clients’ acquisition of primarily IBM hardware, soft-
ware and services.
Global Financing invests in financing assets, manages the associ-
ated risks and leverages with debt, all with the objective of generating
consistently strong returns on equity. The primary focus on IBM
products and IBM clients mitigates the risks normally associated with
a financing company. Global Financing has the benefit of both a deep
knowledge of its client base and a clear insight into the products that
are being leased. This combination allows Global Financing to effec-
tively manage two of the major risks (credit and residual value) that
are normally associated with financing.
Global Financing comprises three lines of business:
• Client financing provides lease and loan financing to end users and
internal clients for terms generally between two and seven years.
Internal financing is predominantly in support of Global Services’
long-term client services contracts. Global Financing also factors a
selected portion of the company’s accounts receivable, primarily for
cash management purposes. All internal financing arrangements
are at arm’s-length rates and are based upon market conditions.
• Commercial financing provides primarily short-term inventory and
accounts receivable financing to dealers and remarketers of IT products.
• Remarketing sells and leases used equipment to new or existing clients
both externally and internally. This equipment is primarily sourced
from the conclusion of lease transactions. Externally-remarketed
equipment revenue represents sales or leases to clients and resellers.
Internally-remarketed equipment revenue primarily represents used
equipment that is sold or leased internally to the Systems and Technology
Group and Global Services segments. The Systems and Technology
Group may also sell the equipment that it purchases from Global
Financing to external clients.
In addition to the strength of the economy and its impact on cor-
porate IT budgets, key drivers of Global Financing’s results are interest
rates and originations. Interest rates directly impact Global Financing’s
business by increasing or decreasing both financing revenue and the
associated borrowing costs. Originations, which determine the asset
base of Global Financing’s annuity-like business, are impacted by
IBM’s non-Global Financing sales volumes and Global Financing’s
participation rates. Participation rates are the propensity of IBM’s cli-
ents to finance their purchases through Global Financing in lieu of
paying IBM up-front cash or financing through a third party.
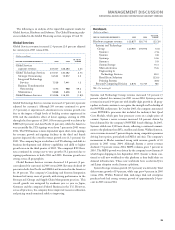
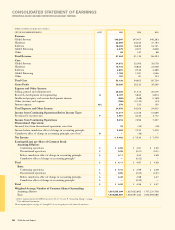
RESULTS OF OPERATIONS
(Dollars in millions)
FOR THE YEAR ENDED DECEMBER 31: 2006 2005 2004
External revenue $, $, $,
Internal revenue , , ,
Total revenue , , ,
Cost , , ,
Gross profit $, $, $,
Gross profit margin .% .% .%
Pre-tax income $, $, $,
After-tax income* $ $, $
Return on equity* .% .% .%
* See page 53 for the details of the After-tax income and the Return on equity calculations.
Total Global Financing revenue decreased 0.4 percent in 2006 as
compared to 2005, driven by a decrease in External revenue. External
revenue decreased 1.5 percent (2.0 percent adjusted for currency)
primarily driven by used equipment sales of $625 million in 2006
versus $681 million in 2005, a decrease of 8.3 percent. Internal revenue
increased 1.4 percent driven by financing revenue of $602 million in
2006 versus $544 million in 2005, an increase of 10.6 percent, par-
tially offset by used equipment sales of $925 million in 2006 versus
$962 million in 2005, a decrease of 3.8 percent. The increase in
financing revenue was due to higher average asset balances and higher
asset yields. The decrease in internal used equipment sales was due to
higher prior-year early terminations of internal leases and the subse-
quent sale of this equipment to Global Services, partially offset by
higher sales to the Systems and Technology Group.
Total Global Financing revenue increased 0.3 percent in 2005 as
compared to 2004, driven by Internal revenue growth. External reve-
nue decreased 7.9 percent (8.6 percent adjusted for currency) primarily
driven by financing revenue of $1,720 million in 2005 versus $1,899
million in 2004, a decrease of 9.4 percent, due to lower average asset
balances and declining asset yields. Internal revenue increased 17.0
percent driven by used equipment sales of $962 million in 2005 versus
$716 million in 2004, an increase of 34.4 percent, partially offset by
financing income of $544 million in 2005 versus $571 million in 2004,
a decrease of 4.7 percent. The increase in internal used equipment
sales was due to higher sales to the Systems and Technology Group,
as well as higher early terminations of internal leases and the subse-
quent sale of this equipment to Global Services.
MANAGEMENT DISCUSSION
INTERNATIONAL BUSINESS MACHINES CORPORATION AND SUBSIDIARY COMPANIES
49
Black
MAC
2718 CG10