IBM 2006 Annual Report Download - page 31
Download and view the complete annual report
Please find page 31 of the 2006 IBM annual report below. You can navigate through the pages in the report by either clicking on the pages listed below, or by using the keyword search tool below to find specific information within the annual report.-
 1
1 -
2
-
3
-
4
-
5
-
6
-
7
-
8
-
9
-
10
-
11
-
12
-
13
-
14
-
15
-
16
-
17
-
18
-
19
-
20
-
 21
21 -
 22
22 -
 23
23 -
 24
24 -
 25
25 -
 26
26 -
 27
27 -
 28
28 -
 29
29 -
 30
30 -
 31
31 -
 32
32 -
 33
33 -
 34
34 -
 35
35 -
 36
36 -
 37
37 -
 38
38 -
 39
39 -
 40
40 -
 41
41 -
42
-
43
-
44
-
45
-
46
-
47
-
48
-
49
-
50
-
51
-
52
-
53
-
54
-
55
-
56
-
57
-
58
-
59
-
60
-
61
-
62
-
63
-
64
-
65
-
66
-
67
-
68
-
69
-
70
-
71
-
72
-
73
-
74
-
75
-
76
-
77
-
78
-
79
-
80
-
81
-
82
-
83
-
84
-
85
-
86
-
87
-
88
-
89
-
90
-
91
-
92
-
93
-
94
-
95
-
96
-
97
-
98
-
99
-
100
-
101
-
102
-
103
-
104
-
105
-
106
-
107
-
108
-
109
-
110
-
111
-
112
-
113
-
114
-
115
-
116
-
117
-
118
-
119
-
120
-
121
-
122
-
123
-
124
 |
 |

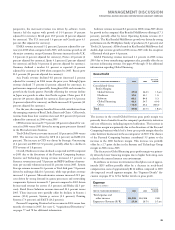
SEGMENT DETAILS
The following is an analysis of the 2006 versus 2005 reportable
segment results. The analysis of 2005 versus 2004 reportable segment
results is on pages 39 and 40.
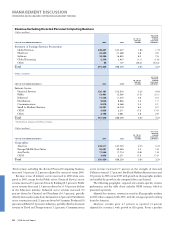
The following table presents each reportable segment’s external
revenue as a percentage of total external segment revenue, excluding
the Personal Computing business.
FOR THE YEAR ENDED DECEMBER 31: 2006 2005
Global Technology Services .% .%
Global Business Services . .
Total Global Services . .
Hardware . .
Global Financing . .
Total Hardware/Financing . .
Software . .
Total .% .%
The table below presents each reportable segment’s pre-tax income as
a percentage of total reportable segment pre-tax income, excluding
the Personal Computing business and the 2005 restructuring charges.
Segment pre-tax income includes transactions between the segments
that are intended to reflect an arms-length transfer price.
FOR THE YEAR ENDED DECEMBER 31: 2006 2005
Global Technology Services .% .%
Global Business Services . .
Total Global Services . .
Hardware . .
Global Financing . .
Total Hardware/Financing . .
Software . .
Total .% .%
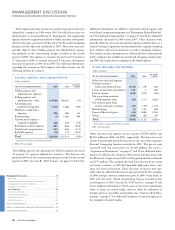
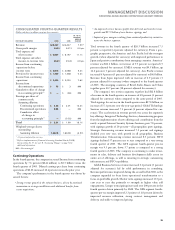
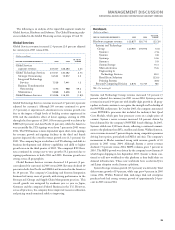
Global Services
The company’s two services segments, Global Technology Services
and Global Business Services had revenue of $48,291 million, an
increase of 1.9 percent (2 percent adjusted for currency) in 2006 ver-
sus 2005. Revenue growth and the profile of the services business
improved throughout 2006.
(Dollars in millions)
YR. TO YR.
FOR THE YEAR ENDED DECEMBER 31: 2006 2005 CHANGE
Global Services
segment revenue: $, $, .%
Global Technology Services $, $, .%
Strategic Outsourcing , , .
Integrated Technology
Services , , (.)
Business Transformation
Outsourcing , , .
Maintenance , , .
Global Business Services $, $, .%
Global Technology Services revenue increased 2.6 percent (2 per-
cent adjusted for currency) in 2006 versus the prior year period. Total
signings in GTS increased 1 percent in 2006 when compared to 2005,
with shorter term signings increasing 5 percent while longer term
signings were flat.
Revenue from Strategic Outsourcing was up 3.2 percent (3 percent
adjusted for currency) due primarily to signings growth in 2005 and a
continued focus on increasing services into existing accounts. Signings
in 2006 increased 7 percent when compared to 2005.
Integrated Technology Services revenue decreased 1.2 percent (2
percent adjusted for currency) in 2006 versus 2005. The rate of reve-
nue growth in ITS improved during the second half of 2006 reflecting
progress from the changes implemented throughout 2006 to improve
the ITS business, including streamlining offerings and aligning skills
to address higher growth and higher value areas. The acquisition of
Internet Security Systems Inc. (ISS), added to the company’s capabili-
ties in security and intrusion protection, and contributed to improved
performance in the fourth quarter. ITS signings increased 5 percent in
2006 over the year-ago period.
Business Transformation Outsourcing revenue increased 17.2
percent (17 percent adjusted for currency) in 2006 when compared to
2005. The rate of growth in BTO was negatively impacted by a sig-
nificant contract renegotiation in 2006 which will continue through
the first quarter of 2007. While BTO signings in 2006 decreased 33
percent versus 2005, the company continues to see opportunity within
this business, particularly in Finance and Accounting, Human
Resources and Procurement.
Maintenance revenue increased 2.0 percent (2 percent adjusted for
currency) driven by increased availability services on non-IBM IT
equipment, primarily in the Americas and Asia Pacific geographies.
The GTS segment pre-tax margin was 9.6 percent in 2006, an
increase of 1.9 points versus 2005. The improvement was primarily
the result of the incremental restructuring charges recorded in the
second quarter of 2005 and the continued focus on productivity ini-
tiatives. The company is continuing to make investments in sales,
delivery and business development skills across the entire set of GTS
offerings, as well as investing in strategic outsourcing infrastructure
and BTO capabilities.
Global Business Services revenue increased 0.4 percent (1 percent
adjusted for currency) in 2006 versus 2005. The rate of year-over-year
revenue growth in GBS increased in the second half of 2006 reflecting
progress made on actions taken throughout the year that focused on
operational transformation and profitable growth initiatives. Total sign-
ings in GBS increased 10 percent in 2006. Shorter term signings were
up 6 percent; with particular strength in the larger, higher value-add
engagements during the second half of the year. Longer term signings
increased 17 percent, driven by the Application Management business.
The GBS segment pre-tax margin was 9.8 percent in 2006, an
improvement of 5.3 points versus 2005. In addition to the benefits
received from the incremental restructuring charges recorded in the
second quarter of 2005 (2.6 points of improvement), the margin
improvement was driven by improved utilization, better contract
management and delivery and stable-to-improved pricing.
MANAGEMENT DISCUSSION
INTERNATIONAL BUSINESS MACHINES CORPORATION AND SUBSIDIARY COMPANIES
29
Black
MAC
2718 CG10