IBM 2006 Annual Report Download - page 52
Download and view the complete annual report
Please find page 52 of the 2006 IBM annual report below. You can navigate through the pages in the report by either clicking on the pages listed below, or by using the keyword search tool below to find specific information within the annual report.-
 1
1 -
2
-
3
-
4
-
5
-
6
-
7
-
8
-
9
-
10
-
11
-
12
-
13
-
14
-
15
-
16
-
17
-
18
-
19
-
20
-
21
-
22
-
23
-
24
-
25
-
26
-
27
-
28
-
29
-
30
-
31
-
32
-
33
-
34
-
35
-
36
-
37
-
38
-
39
-
40
-
41
-
 42
42 -
 43
43 -
 44
44 -
 45
45 -
 46
46 -
 47
47 -
 48
48 -
 49
49 -
 50
50 -
 51
51 -
 52
52 -
 53
53 -
 54
54 -
 55
55 -
 56
56 -
 57
57 -
 58
58 -
 59
59 -
 60
60 -
 61
61 -
 62
62 -
63
-
64
-
65
-
66
-
67
-
68
-
69
-
70
-
71
-
72
-
73
-
74
-
75
-
76
-
77
-
78
-
79
-
80
-
81
-
82
-
83
-
84
-
85
-
86
-
87
-
88
-
89
-
90
-
91
-
92
-
93
-
94
-
95
-
96
-
97
-
98
-
99
-
100
-
101
-
102
-
103
-
104
-
105
-
106
-
107
-
108
-
109
-
110
-
111
-
112
-
113
-
114
-
115
-
116
-
117
-
118
-
119
-
120
-
121
-
122
-
123
-
124
 |
 |

MANAGEMENT DISCUSSION
INTERNATIONAL BUSINESS MACHINES CORPORATION AND SUBSIDIARY COMPANIES
50 2006 Annual Report
Global Financing gross profit dollars decreased $140 million or
6.2 percent and gross profit margin declined 3.3 points in 2006 versus
2005. The decrease in gross profit dollars was primarily driven by
borrowing costs of $813 million in 2006 versus $641 million in 2005,
an increase of 26.8 percent, primarily related to the interest rate envi-
ronment during the year, and equipment sales gross profit of $591
million in 2006 versus $637 million in 2005, a decrease of 7.2 percent
due to the decrease in used equipment sales discussed previously. This
was partially offset by the increase in financing revenue also discussed
above. The decrease in gross profit margin was driven by lower
financing margins due to higher borrowing costs related to the inter-
est rate environment during the year and a decrease in equipment
sales margins, partially offset by a mix change away from lower mar-
gin remarketing sales towards higher margin financing income.
Global Financing gross profit dollars decreased $95 million or 4.0
percent and gross profit margin declined 2.7 points in 2005 versus
2004. The decrease in gross profit dollars was primarily driven by the
decline in financing revenue discussed above and borrowing costs of
$641 million in 2005 versus $608 million in 2004, an increase of 5.5
percent related to the interest rate environment during the year, par-
tially offset by equipment sales gross profit of $637 million in 2005
versus $492 million in 2004, an increase of 29.4 percent due to the
increase in used equipment sales discussed previously. The decrease in
gross profit margin was driven by a mix change towards lower margin
remarketing sales and away from higher margin financing income and
lower financing margins due to higher borrowing costs related to the
interest rate environment during the year, partially offset by an
improvement in equipment sales margins.
Global Financing pre-tax income decreased 8.1 percent in 2006
versus 2005, compared to an increase of 8.6 percent in 2005 versus
2004. The decrease in 2006 was primarily driven by the decrease in
gross profit of $140 million. The increase in 2005 versus 2004 was
driven by a decrease of $140 million in bad debt expense and a
decrease of $78 million in SG&A expense, partially offset by the
decrease in gross profit of $95 million. The decrease in bad debt
expense in 2005 was reflective of the improved general economic
environment, improved credit quality of the portfolio and the declin-
ing size of the receivables portfolio. (See page 51 for a discussion of
Global Financing Receivables and Allowances.)
The decrease in return on equity from 2005 to 2006 was primarily
due to lower earnings and the increase from 2004 to 2005 was primarily
due to higher earnings.
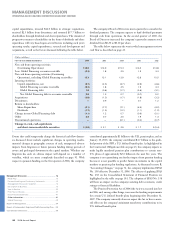
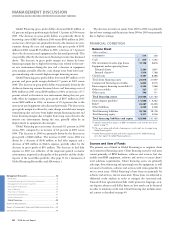
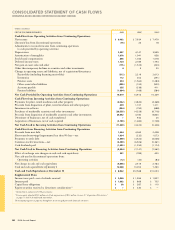
FINANCIAL CONDITION
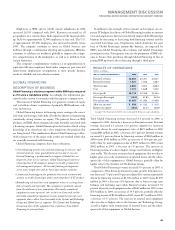
Balance Sheet
(Dollars in millions)
AT DECEMBER 31: 2006 2005
Cash $ $ ,
Net investment in sales-type leases , ,
Equipment under operating leases:
External clients , ,
Internal clients(a)(b) , ,
Client loans , ,
Total client financing assets , ,
Commercial financing receivables , ,
Intercompany financing receivables(a)(b) , ,
Other receivables
Other assets
Total financing assets $, $,
Intercompany payables(a) $ , $ ,
Debt(c) , ,
Other liabilities , ,
Total financing liabilities , ,
Total financing equity , ,
Total financing liabilities and equity $, $,
(a) Amounts eliminated for purposes of IBM’s consolidated results and therefore do not
appear on page 57.
(b) These assets, along with all other financing assets in this table, are leveraged using
Global Financing debt.
(c)
Global Financing debt includes debt of the company and of the Global Financing
units that support the Global Financing business.
Sources and Uses of Funds
The primary use of funds in Global Financing is to originate client
and commercial financing assets. Client financing assets for end users
consist primarily of IBM hardware, software and services, but also
include non-IBM equipment, software and services to meet clients’
total solutions requirements. Client financing assets are primarily
sales type, direct financing and operating leases for equipment, as well
as loans for hardware, software and services with terms generally for
two to seven years. Global Financing’s client loans are primarily for
software and services, and are unsecured. These loans are subjected to
additional credit analysis in order to mitigate the associated risk.
Unsecured loan agreements include credit protective language, secu-
rity deposit advances and dollar limits on how much can be financed
in order to minimize credit risk. Client financing also includes inter-
nal activity as described on page 49.
Management Discussion ........................................................
Road Map .............................................................................
Forward-Looking and Cautionary Statements .....................
Management Discussion Snapshot ......................................
Description of Business .......................................................
Year in Review......................................................................
Prior Year in Review .............................................................
Discontinued Operations .....................................................
Other Information ................................................................
Global Financing ..................................................................
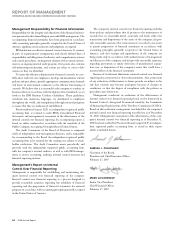
Report of Management .........................................................
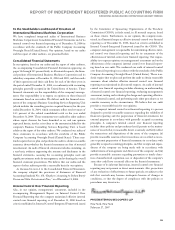
Report of Independent Registered Public Accounting Firm ....
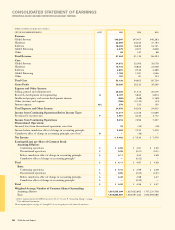
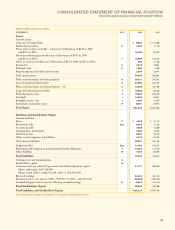
Consolidated Statements .......................................................
Black
MAC
2718 CG10