IBM 2006 Annual Report Download - page 29
Download and view the complete annual report
Please find page 29 of the 2006 IBM annual report below. You can navigate through the pages in the report by either clicking on the pages listed below, or by using the keyword search tool below to find specific information within the annual report.-
 1
1 -
2
-
3
-
4
-
5
-
6
-
7
-
8
-
9
-
10
-
11
-
12
-
13
-
14
-
15
-
16
-
17
-
18
-
 19
19 -
 20
20 -
 21
21 -
 22
22 -
 23
23 -
 24
24 -
 25
25 -
 26
26 -
 27
27 -
 28
28 -
 29
29 -
 30
30 -
 31
31 -
 32
32 -
 33
33 -
 34
34 -
 35
35 -
 36
36 -
 37
37 -
 38
38 -
 39
39 -
40
-
41
-
42
-
43
-
44
-
45
-
46
-
47
-
48
-
49
-
50
-
51
-
52
-
53
-
54
-
55
-
56
-
57
-
58
-
59
-
60
-
61
-
62
-
63
-
64
-
65
-
66
-
67
-
68
-
69
-
70
-
71
-
72
-
73
-
74
-
75
-
76
-
77
-
78
-
79
-
80
-
81
-
82
-
83
-
84
-
85
-
86
-
87
-
88
-
89
-
90
-
91
-
92
-
93
-
94
-
95
-
96
-
97
-
98
-
99
-
100
-
101
-
102
-
103
-
104
-
105
-
106
-
107
-
108
-
109
-
110
-
111
-
112
-
113
-
114
-
115
-
116
-
117
-
118
-
119
-
120
-
121
-
122
-
123
-
124
 |
 |

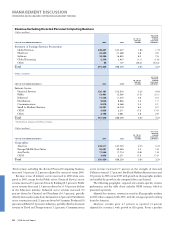
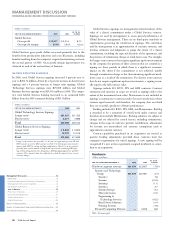
RESEARCH, DEVELOPMENT AND ENGINEERING
(Dollars in millions)
YR. TO YR.
FOR THE YEAR ENDED DECEMBER 31: 2006 2005 CHANGE
Research, development
and engineering:
Total $, $, .%
The increase in Research, development and engineering (RD&E)
was primarily driven by acquisitions and the company’s investments to
maintain its technology leadership across the product offerings. Soft-
ware spending increased $210 million and Systems and Technology
spending increased $92 million in 2006 versus 2005. These increases
were partially offset by the year-to-year reduction in the Personal
Computing Division of $52 million due to the divestiture of that
business in the prior year. Retirement-related expense increased $32
million in 2006 versus 2005, partially offset by lower stock-based
compensation expense of $18 million.
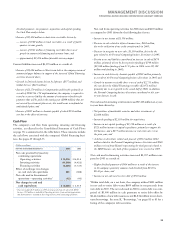
INTELLECTUAL PROPERTY AND
CUSTOM DEVELOPMENT INCOME
(Dollars in millions)
YR. TO YR.
FOR THE YEAR ENDED DECEMBER 31: 2006 2005 CHANGE
Intellectual property and
custom development income:
Sales and other transfers
of intellectual property $ $ (.)%
Licensing/royalty-based fees (.)
Custom development income .
Total $ $ (.)%
The timing and amount of Sales and other transfers of IP may vary
significantly from period to period depending upon timing of divesti-
tures, industry consolidation, economic conditions and the timing of
new patents and know-how development. There were no significant
IP transactions in 2006 and 2005.
INTEREST EXPENSE
(Dollars in millions)
YR. TO YR.
FOR THE YEAR ENDED DECEMBER 31: 2006 2005 CHANGE
Interest expense:
Total $ $ .%
The increase in Interest expense was primarily driven by higher effec-
tive interest rates in 2006 versus 2005. Interest expense is presented in
Cost of Global Financing in the Consolidated Statement of Earnings
only if the related external borrowings are to support the Global
Financing external business. See page 52 for additional information
regarding Global Financing debt and interest expense.
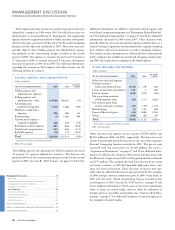
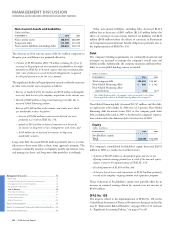
Stock-Based Compensation
Total pre-tax stock-based compensation expense of $846 million
decreased $189 million compared to 2005. The decrease was princi-
pally the result of: (1) a reduction in the level and fair value of stock
option grants ($284 million), (2) changes to the terms of the company’s
employee stock purchase plan, which rendered it non-compensatory
in the second quarter of 2005 in accordance with the provisions of
SFAS No. 123(R) ($18 million), offset by (3) increased expense for
performance-based stock units ($34 million) resulting from changes
in the probabilities of achieving performance metrics and (4) an
increase in the level of restricted stock units ($78 million). The effects
on pre-tax stock-based compensation expense of the 2005 sale of the
Personal Computing business were recorded in Other (income) and
expense in the Consolidated Statement of Earnings for the year ended
December 31, 2005. The year-to-year reductions in pre-tax compen-
sation expense were reflected in the following categories: Cost ($114
million); Selling, general and administrative expense ($65 million);
Research, development and engineering ($18 million); and an increase
in Other (income) and expense ($8 million).
There was no significant capitalized stock-based compensation
expense at December 31, 2006 and 2005.
See note U, “Stock-Based Compensation,” on page 96 to 100 for
additional information on the company’s stock-based incentive awards.
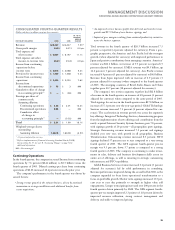
Retirement-Related Benefits
The following table provides the total pre-tax cost for all retirement-
related plans. Cost amounts are included as an addition to the cost and
expense amounts in the Consolidated Statement of Earnings within
the caption (e.g., Cost, SG&A, RD&E) relating to the job function of
the individuals participating in the plans.
(Dollars in millions)
YR. TO YR.
FOR THE YEAR ENDED DECEMBER 31: 2006 2005* CHANGE
Retirement-related plans cost:
Defined benefit and
contribution pension
plans cost $, $, .%
Nonpension postretirement
plans costs .
Plan amendments/curtailments — NM
Total $, $, (.)%
* Reclassified to conform with 2006 presentation.
NM—Not meaningful
Overall, retirement-related plan costs decreased $9 million versus
2005. The 2005 retirement-related plan costs included $332 million
related to unique items: a curtailment charge of $267 million recorded
in the fourth quarter as a result of U.S. pension plan amendments and
a $65 million charge recorded in the second quarter related to the
MANAGEMENT DISCUSSION
INTERNATIONAL BUSINESS MACHINES CORPORATION AND SUBSIDIARY COMPANIES
27
Black
MAC
2718 CG10