IBM 2006 Annual Report Download - page 53
Download and view the complete annual report
Please find page 53 of the 2006 IBM annual report below. You can navigate through the pages in the report by either clicking on the pages listed below, or by using the keyword search tool below to find specific information within the annual report.-
 1
1 -
2
-
3
-
4
-
5
-
6
-
7
-
8
-
9
-
10
-
11
-
12
-
13
-
14
-
15
-
16
-
17
-
18
-
19
-
20
-
21
-
22
-
23
-
24
-
25
-
26
-
27
-
28
-
29
-
30
-
31
-
32
-
33
-
34
-
35
-
36
-
37
-
38
-
39
-
40
-
41
-
42
-
 43
43 -
 44
44 -
 45
45 -
 46
46 -
 47
47 -
 48
48 -
 49
49 -
 50
50 -
 51
51 -
 52
52 -
 53
53 -
 54
54 -
 55
55 -
 56
56 -
 57
57 -
 58
58 -
 59
59 -
 60
60 -
 61
61 -
 62
62 -
 63
63 -
64
-
65
-
66
-
67
-
68
-
69
-
70
-
71
-
72
-
73
-
74
-
75
-
76
-
77
-
78
-
79
-
80
-
81
-
82
-
83
-
84
-
85
-
86
-
87
-
88
-
89
-
90
-
91
-
92
-
93
-
94
-
95
-
96
-
97
-
98
-
99
-
100
-
101
-
102
-
103
-
104
-
105
-
106
-
107
-
108
-
109
-
110
-
111
-
112
-
113
-
114
-
115
-
116
-
117
-
118
-
119
-
120
-
121
-
122
-
123
-
124
 |
 |

Commercial financing receivables arise primarily from inventory
and accounts receivable financing for dealers and remarketers of IBM
and non-IBM products. Payment terms for inventory financing and
accounts receivable financing generally range from 30 to 90 days.
These short-term receivables are primarily unsecured and are also sub-
ject to additional credit actions in order to mitigate the associated risk.
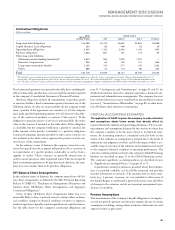
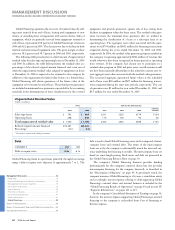
Originations
The following are total external and internal financing originations.
(Dollars in millions)
FOR THE YEAR ENDED DECEMBER 31: 2006 2005 2004
Client financing:
External $, $, $,
Internal , , ,
Commercial financing , , ,
Total $, $, $,
New financing originations exceeded cash collections for both client
and commercial financing in 2006, which resulted in a net increase in
financing assets from December 31, 2005. The increase in origina-
tions in 2006 versus 2005 was due to improving volumes in both client
and commercial financing. The increase from 2005 versus 2004 was
driven by an improvement in commercial financing partially offset by
a decline in client financing.
Cash generated by Global Financing in 2006 was deployed to pay
intercompany payables and dividends to IBM.
Financing Assets by Sector
The following are the percentages of external financing assets by
industry sector.
AT DECEMBER 31: 2006 2005
Financial Services % %
Business Partners*
Industrial
Public
Distribution
Communications
Other
Total % %
* Business Partners’ financing assets represent a portion of commercial financing
inventory and accounts receivable financing for terms generally less than 90 days.
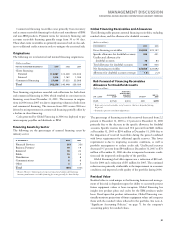
Global Financing Receivables and Allowances
The following table presents external financing receivables, excluding
residual values, and the allowance for doubtful accounts.
(Dollars in millions)
AT DECEMBER 31: 2006 2005
Gross financing receivables $, $,
Specific allowance for doubtful accounts
Unallocated allowance for
doubtful accounts
Total allowance for doubtful accounts
Net financing receivables $, $,
Allowance for doubtful account coverage .% .%
Roll-Forward of Financing Receivables
Allowance for Doubtful Accounts
(Dollars in millions)
ADDITIONS/
(REDUCTIONS)
ALLOWANCE BAD DEBT DEC. 31,
JAN. 1, 2006 USED* EXPENSE OTHER** 2006
$ $() $() $ $
* Represents reserved receivables, net of recoveries, that were disposed of during
the period.
** Primarily represents translation adjustments.
The percentage of financing receivables reserved decreased from 2.2
percent at December 31, 2005 to 1.5 percent at December 31, 2006
primarily due to the decrease in the specific allowance for doubtful
accounts. Specific reserves decreased 30.2 percent from $421 million
at December 31, 2005 to $294 million at December 31, 2006 due to
the disposition of reserved receivables during the period combined
with lower requirements for additional specific reserves. This lower
requirement is due to improving economic conditions, as well as
portfolio management to reduce credit risk. Unallocated reserves
decreased 9.5 percent from $84 million at December 31, 2005 to $76
million at December 31, 2006 also due to improved economic condi-
tions and the improved credit quality of the portfolio.
Global Financing’s bad debt expense was a reduction of $20 mil-
lion for 2006 and a reduction of $35 million for 2005. The continued
reduction was primarily attributable to the improvement in economic
conditions and improved credit quality of the portfolio during 2006.
Residual Value
Residual value is a risk unique to the financing business and manage-
ment of this risk is dependent upon the ability to accurately project
future equipment values at lease inception. Global Financing has
insight into product plans and cycles for the IBM products under
lease. Based upon this product information, Global Financing con-
tinually monitors projections of future equipment values and compares
them with the residual values reflected in the portfolio. See note A,
“Significant Accounting Policies,” on page 71 for the company’s
accounting policy for residual values.
MANAGEMENT DISCUSSION
INTERNATIONAL BUSINESS MACHINES CORPORATION AND SUBSIDIARY COMPANIES
51
Black
MAC
2718 CG10