IBM 2006 Annual Report Download - page 28
Download and view the complete annual report
Please find page 28 of the 2006 IBM annual report below. You can navigate through the pages in the report by either clicking on the pages listed below, or by using the keyword search tool below to find specific information within the annual report.-
 1
1 -
2
-
3
-
4
-
5
-
6
-
7
-
8
-
9
-
10
-
11
-
12
-
13
-
14
-
15
-
16
-
17
-
 18
18 -
 19
19 -
 20
20 -
 21
21 -
 22
22 -
 23
23 -
 24
24 -
 25
25 -
 26
26 -
 27
27 -
 28
28 -
 29
29 -
 30
30 -
 31
31 -
 32
32 -
 33
33 -
 34
34 -
 35
35 -
 36
36 -
 37
37 -
 38
38 -
39
-
40
-
41
-
42
-
43
-
44
-
45
-
46
-
47
-
48
-
49
-
50
-
51
-
52
-
53
-
54
-
55
-
56
-
57
-
58
-
59
-
60
-
61
-
62
-
63
-
64
-
65
-
66
-
67
-
68
-
69
-
70
-
71
-
72
-
73
-
74
-
75
-
76
-
77
-
78
-
79
-
80
-
81
-
82
-
83
-
84
-
85
-
86
-
87
-
88
-
89
-
90
-
91
-
92
-
93
-
94
-
95
-
96
-
97
-
98
-
99
-
100
-
101
-
102
-
103
-
104
-
105
-
106
-
107
-
108
-
109
-
110
-
111
-
112
-
113
-
114
-
115
-
116
-
117
-
118
-
119
-
120
-
121
-
122
-
123
-
124
 |
 |

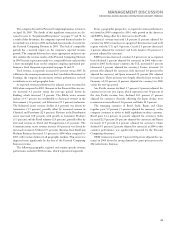
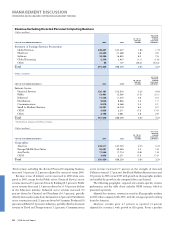
Total expense and other income increased 2.8 percent (2.4 percent
adjusted for currency) in 2006 versus 2005. Overall, the increase was
primarily due to increased Research, development and engineering
expense driven by acquisitions and lower Other (income) and expense
driven by the gain associated with the sale of the Personal Computing
business and the Microsoft settlement in 2005. These increases were
partially offset by lower Selling, general and administrative expense
due primarily to the restructuring charges recorded in the second
quarter of 2005. The expense-to-revenue ratio increased 0.7 points to
27.3 percent in 2006, as revenue increased 0.3 percent and expense
increased 2.8 percent in 2006 versus 2005. For additional information
regarding the increase in Total expense and other income, see the
following analyses by category:
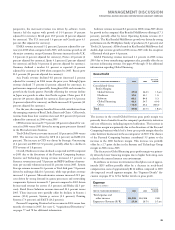
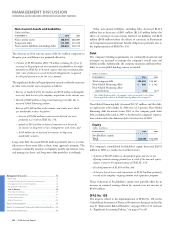
SELLING, GENERAL AND ADMINISTRATIVE
(Dollars in millions)
YR. TO YR.
FOR THE YEAR ENDED DECEMBER 31: 2006 2005* CHANGE
Selling, general and
administrative expense:
Selling, general and
administrative—base $, $, .%
Advertising and
promotional expense , , (.)
Workforce reductions—
ongoing .
Restructuring () , NM
Amortization expense—
acquired intangibles (.)
Retirement-related expense (.)
Stock-based compensation (.)
Bad debt expense () () (.)
Total $, $, (.)%
* Reclassified to conform with 2006 presentation.
NM—Not meaningful
Total Selling, general and administrative (SG&A) expense decreased
4.9 percent (5.3 percent adjusted for currency). The decrease was
primarily driven by the restructuring charges recorded in the second
quarter of 2005. See note R, “2005 Actions,” on pages 93 and 94 for
additional information. In addition, retirement-related expense and
stock-based compensation expense (see “Retirement-Related Benefits”
and “Stock-Based Compensation,” on pages 27 and 28 for additional
information) decreased in 2006 versus 2005. These decreases were
partially offset by increased operational expenses (SG&A-base) as a
result of strategic acquisitions and investments the company is making
in its software and services businesses as well as emerging countries.
The returns on these investments are reflected in the revenue growth
in the company’s key middleware brands and emerging countries dur-
ing 2006 and strong services signings in the fourth quarter.
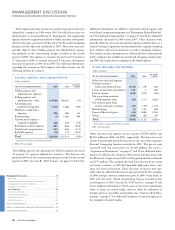
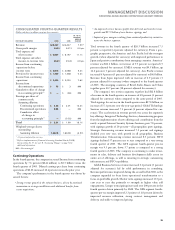
OTHER (INCOME) AND EXPENSE
(Dollars in millions)
YR. TO YR.
FOR THE YEAR ENDED DECEMBER 31: 2006 2005* CHANGE
Other (income) and expense:
Foreign currency
transaction (gains)/losses $() $ NM
Losses on derivative instruments NM
Interest income () () .%
Net gains from securities
and investments assets () () (.)
Net realized gains from
certain real estate activities () () (.)
Restructuring () NM
Lenovo/Microsoft gains () (,) (.)
Other () () .
Total $() $(,) (.)%
* Reclassified to conform with 2006 presentation.
NM—Not meaningful
Other (income) and expense was net income of $766 million and
$2,122 million in 2006 and 2005, respectively. The decrease in net
income was primarily driven by the gain on the sale of the company’s
Personal Computing business recorded in 2005. The pre-tax gain
associated with this transaction was $1,108 million. See note C,
“Acquisitions/Divestitures,” on pages 77 and 78 for additional infor-
mation. In addition, the company settled certain antitrust issues with
the Microsoft Corporation in 2005 and the gain from this settlement
was $775 million. The company also had lower income from certain
real estate activities, as 2005 had unusually high gains from a few
large real estate transactions. These decreases in income were par-
tially offset by additional Interest income generated by the company
in 2006; foreign currency transaction gains in 2006 versus losses in
2005 and real estate related restructuring charges recorded in the
second quarter of 2005. See note R, “2005 Actions,” on pages 93 and
94 for additional information. The Losses on derivative instruments
relate to losses on certain hedge contracts offset by settlement of
foreign currency receivables and payables. See “Currency Rate Fluc-
tuations,” on page 47 for additional discussion of currency impacts on
the company’s financial results.
MANAGEMENT DISCUSSION
INTERNATIONAL BUSINESS MACHINES CORPORATION AND SUBSIDIARY COMPANIES
26 2006 Annual Report
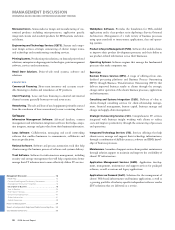
Management Discussion ........................................................
Road Map .............................................................................
Forward-Looking and Cautionary Statements .....................
Management Discussion Snapshot ......................................
Description of Business .......................................................
Year in Review......................................................................
Prior Year in Review .............................................................
Discontinued Operations .....................................................
Other Information ................................................................
Global Financing ..................................................................
Report of Management .........................................................
Report of Independent Registered Public Accounting Firm ....
Consolidated Statements .......................................................
Black
MAC
2718 CG10