IBM 2006 Annual Report Download - page 42
Download and view the complete annual report
Please find page 42 of the 2006 IBM annual report below. You can navigate through the pages in the report by either clicking on the pages listed below, or by using the keyword search tool below to find specific information within the annual report.-
 1
1 -
2
-
3
-
4
-
5
-
6
-
7
-
8
-
9
-
10
-
11
-
12
-
13
-
14
-
15
-
16
-
17
-
18
-
19
-
20
-
21
-
22
-
23
-
24
-
25
-
26
-
27
-
28
-
29
-
30
-
31
-
 32
32 -
 33
33 -
 34
34 -
 35
35 -
 36
36 -
 37
37 -
 38
38 -
 39
39 -
 40
40 -
 41
41 -
 42
42 -
 43
43 -
 44
44 -
 45
45 -
 46
46 -
 47
47 -
 48
48 -
 49
49 -
 50
50 -
 51
51 -
 52
52 -
53
-
54
-
55
-
56
-
57
-
58
-
59
-
60
-
61
-
62
-
63
-
64
-
65
-
66
-
67
-
68
-
69
-
70
-
71
-
72
-
73
-
74
-
75
-
76
-
77
-
78
-
79
-
80
-
81
-
82
-
83
-
84
-
85
-
86
-
87
-
88
-
89
-
90
-
91
-
92
-
93
-
94
-
95
-
96
-
97
-
98
-
99
-
100
-
101
-
102
-
103
-
104
-
105
-
106
-
107
-
108
-
109
-
110
-
111
-
112
-
113
-
114
-
115
-
116
-
117
-
118
-
119
-
120
-
121
-
122
-
123
-
124
 |
 |

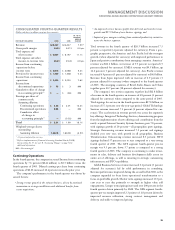
Microelectronics revenue increased 15.6 percent due to improved
manufacturing yields and volumes for game processors. The fourth
quarter of 2005 was the first full quarter of production for these pro-
cessors. Partially offsetting this increase was a softening of demand for
some of the company’s older technology. E&TS revenue continued to
show strong growth (39.2 percent) as it represents a unique opportunity
for the company to leverage its deep capabilities, expertise and assets in
engineering design to benefit client engineering and R&D processes.
Retail Stores Solutions revenue decreased 23.0 percent primarily
due to a number of large transactions in 2004 and demand from these
clients declined in 2005. Printing Systems revenue decreased 8.6 per-
cent due primarily to lower hardware and maintenance sales.
Personal Computing Division revenue decreased as a result of the
company divesting its Personal Computing business to Lenovo on
April 30, 2005. The 2005 results have four months of revenue versus
12 months in 2004.
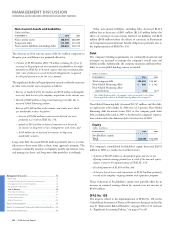
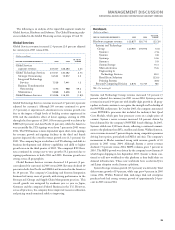
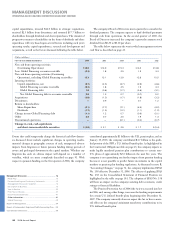
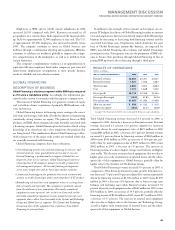
Software
(Dollars in millions)
YR. TO YR.
FOR THE YEAR ENDED DECEMBER 31: 2005 2004* CHANGE
Software segment revenue: $, $, .%
Middleware $, $, .%
Key Branded Middleware , , .
WebSphere family .
Information Management .
Lotus .
Tivoli .
Rational .
Other middleware , , (.)
Operating systems , , (.)
Product Lifecycle
Management , , .
Other .
* Reclassified to conform with 2005 presentation.
Software revenue increased 4.3 percent (4 percent adjusted for cur-
rency) in 2005 versus 2004 as the software market remained highly
competitive. Revenue growth was driven by the performance of the
key Middleware brands, which increased 8.9 percent.
Revenue from the WebSphere family of products increased 10.2
percent with growth in WebSphere Application Servers (15 percent) and
WebSphere Portals (12 percent) versus 2004. The WebSphere family
provides the foundation technologies for clients implementing business
processes and applications in a Services Oriented Architecture (SOA).
Information Management increased 8.2 percent driven by growth
in content management and information integration products.
Lotus increased 9.7 percent as clients continue to demonstrate
strong response to the Domino Version 7 product line, as well as high
interest in Workplace software. Workplace software more than dou-
bled its revenue in 2005 versus 2004.
Tivoli increased 11.5 percent with strong growth in storage soft-
ware as clients’ adoption of the company’s virtualization technologies
continued to gain traction. Tivoli systems management and security
software offerings also had good revenue growth in 2005 versus
2004. The security products revenue was driven by the company’s
new SOA Security offerings.
Rational increased 3.6 percent in 2005 versus 2004; however, late
in the fourth quarter of 2005, client buying deferrals prevented stron-
ger performance.
Revenue from Other middleware products, including host soft-
ware products such as compilers, certain tools and Other Storage and
Printer software declined 1.4 percent versus 2004.
Operating Systems revenue declined 2.0 percent in 2005 versus
2004, primarily due to lower System z and System p revenue, partially
offset by increased System i and System x revenue.
Product Lifecycle Management revenue increased 2.9 percent in
2005 versus 2004, primarily for Industrial (5 percent) and Small &
Medium Business clients (2 percent).
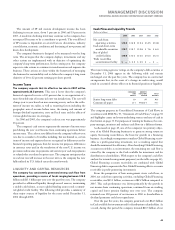
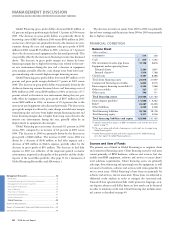
The company’s consolidated gross profit margin increased 3.2
points versus 2004 to 40.1 percent. Margin improvement in both
Hardware and Global Services contributed to the overall increase.
Global Services gross profit margin increased 1.8 points year to
year to 26.0 percent due to benefits from the restructuring actions
taken in the second quarter of 2005, improved utilization/productivity
and a better overall contract profile.
The increase in Hardware margins of 5.5 points to 36.5 percent
was primarily due to the divestiture of the Personal Computing busi-
ness (which had a lower gross profit margin than the other hardware
businesses) in the second quarter of 2005. The absence of the Personal
Computing business contributed 3.8 points to the increase in the 2005
margin. Microelectronics’ margin increased due to improving yields.
The Software margin at 84.9 percent increased 0.3 points due to
growth in Software revenue and reduced external royalty costs.
Total expense and other income decreased 2.4 percent (3 percent
adjusted for currency) in 2005 versus 2004. Overall, the decrease was
primarily due to the gain associated with the divestiture of the
Personal Computing business ($1,108 million), a gain from a legal
settlement with Microsoft ($775 million) partially offset by incremen-
tal restructuring charges ($1,706 million) recorded in the second
quarter of 2005. The expense-to-revenue ratio increased 0.8 points to
26.7 percent in 2005, as revenue declined 5.4 percent and expense
declined 2.4 percent in 2005 versus 2004.
MANAGEMENT DISCUSSION
INTERNATIONAL BUSINESS MACHIN ES CORPORATION AND SUBSI DIARY COMPANIES
40 2006 Annual Report
Management Discussion ........................................................
Road Map .............................................................................
Forward-Looking and Cautionary Statements .....................
Management Discussion Snapshot ......................................
Description of Business .......................................................
Year in Review......................................................................
Prior Year in Review .............................................................
Discontinued Operations .....................................................
Other Information ................................................................
Global Financing ..................................................................
Report of Management .........................................................
Report of Independent Registered Public Accounting Firm ....
Consolidated Statements .......................................................
Black
MAC
2718 CG10